

Midnight price has climbed toward $0.047 after a sharp rally from late-September levels, while the network’s move to permissionless smart contract deployment has added an ecosystem catalyst to its October outlook.
Summary
- NIGHT price trades near $0.047 after breaking above its September trading range.
- Daily moving averages sit below price, while shorter-term momentum has cooled.
- Resistance around $0.052–$0.055 stands between NIGHT and a broader October extension.
- Support near $0.044 remains central to the immediate bullish setup.
TradingView’s Binance NIGHT/USDT daily chart placed Midnight at $0.04694 on Oct. 5, up 5.98% for the session. The price had recovered from roughly $0.0443, although it remained below the early-October spike above $0.053.
The advance has carried NIGHT back into a price region last traded during March. Its daily chart shows a prolonged decline through spring and summer, followed by a recovery from an August base near $0.017–$0.020.
October’s price question now centers on whether buyers can regain $0.050 and clear the recent highs, or whether the rally needs a deeper pullback before continuing.
Midnight opens contract deployment as NIGHT rallies
Midnight announced that developers can deploy smart contracts directly to its mainnet without a mandatory security review on its preproduction network. Applications can also deploy contracts on behalf of users.
The network described the change as a planned next step after its March mainnet launch. Its initial rollout focused on stability, security, and preparation for application developers.
Midnight’s update also reported that Google Cloud supports a dedicated protocol page and a testnet NIGHT faucet through its Web3 portal. The U.S. technology company’s infrastructure is one concrete connection between Midnight’s developer ecosystem and American technology providers.
Other reported developments include Gero Wallet’s version 2.7.1, which added full Midnight application support, shielded balances, and transaction-fee sponsorship. Those tools extend the ways users can access applications built on the network.
Midnight’s documentation distinguishes NIGHT from DUST, the resource used to pay transaction fees. NIGHT is publicly visible, while DUST is shielded and cannot be transferred.
Holders generate DUST by registering NIGHT for resource generation. Applications can use that resource to cover transaction costs, linking NIGHT’s utility to network operations without spending NIGHT itself on each transaction.
Daily averages support the recovery, but price remains stretched
The daily TradingView chart shows NIGHT above all four displayed simple moving averages. The 20-day average sits at $0.03079, the 50-day at $0.02450, the 100-day at $0.02435, and the 200-day at $0.03023.
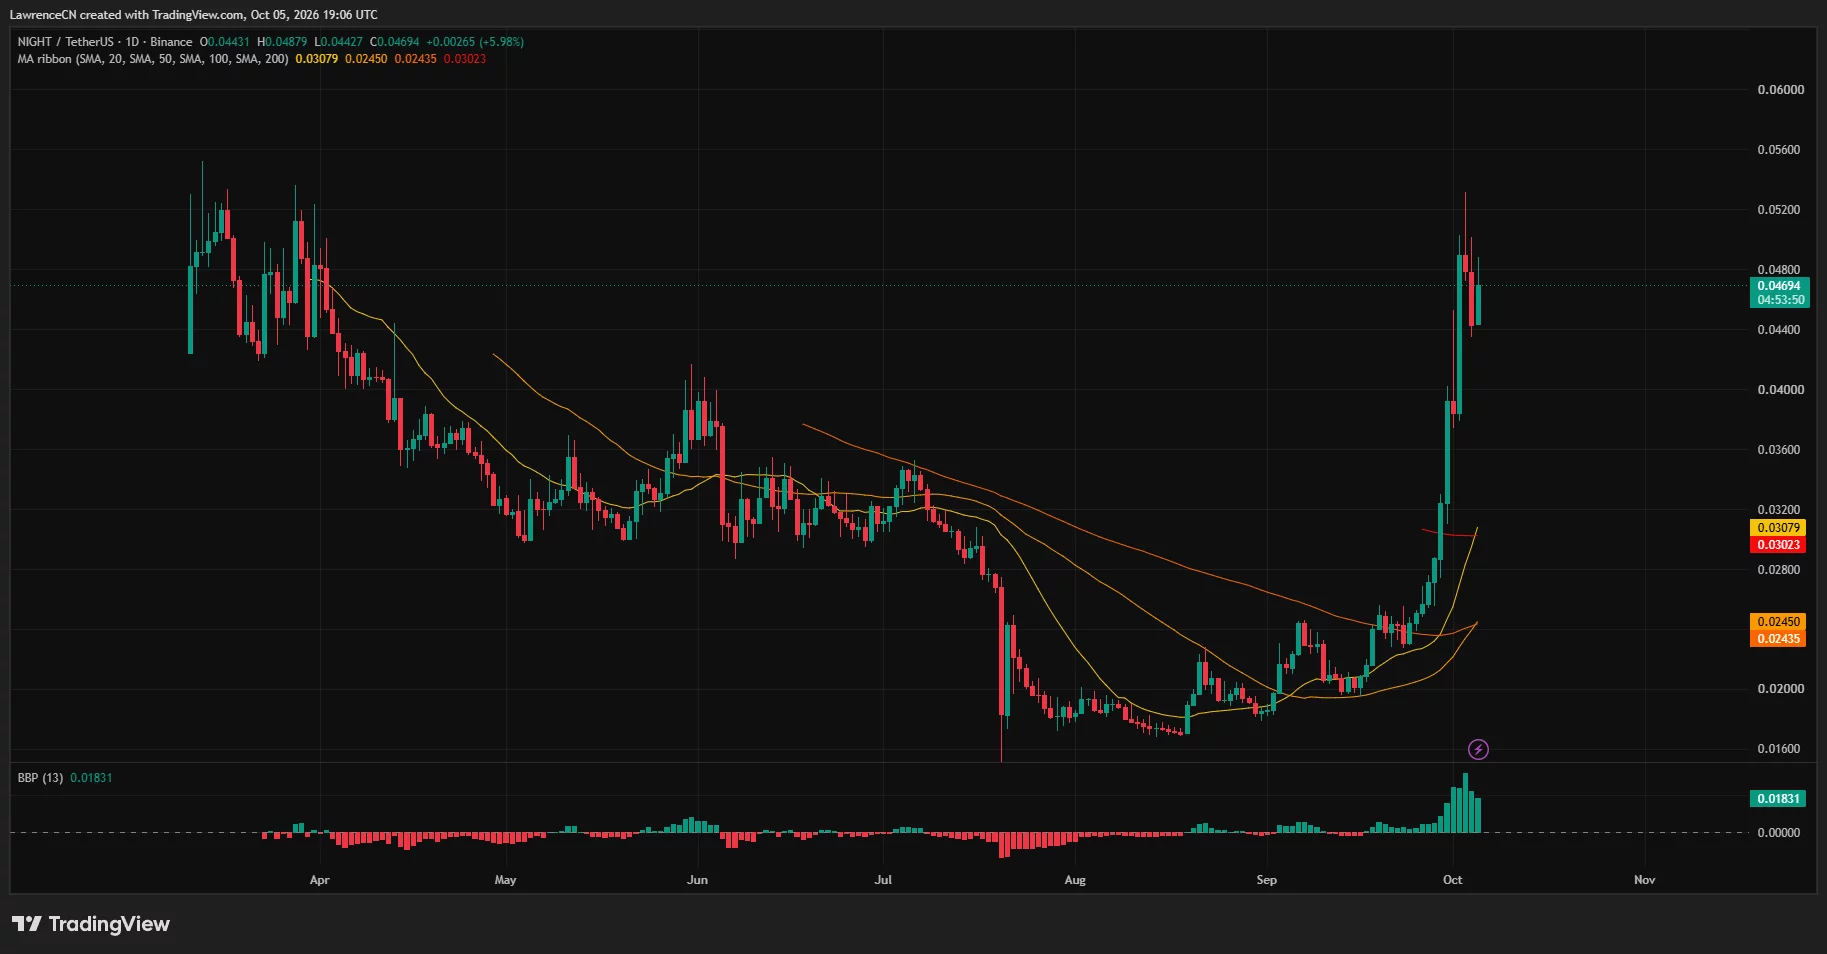
NIGHT trades roughly 52% above its 20-day average. The gap shows how quickly price has advanced relative to its recent trading history and leaves substantial distance between the market and that moving support.
The 20-day average has also moved above the 200-day reading. However, the 50-day and 100-day averages remain below both, reflecting the earlier months of weakness.
TradingView’s daily Bull Bear Power indicator stands at a positive 0.01831. Its recent bars remain above zero, although they have shortened from the largest readings around the rally’s peak.
Taken together, the daily readings favor the recovery while showing less force than at the initial breakout. A return toward the moving averages would require a much larger decline than the recent pullback to $0.044.
The nearer technical test therefore sits around the latest trading range rather than the slower daily averages.
NIGHT needs $0.0481 before another test of $0.052
The 4-hour TradingView chart places NIGHT at $0.04697, below the Bollinger Bands’ middle line at $0.04812. The upper band sits at $0.05190, while the lower band is at $0.04435.
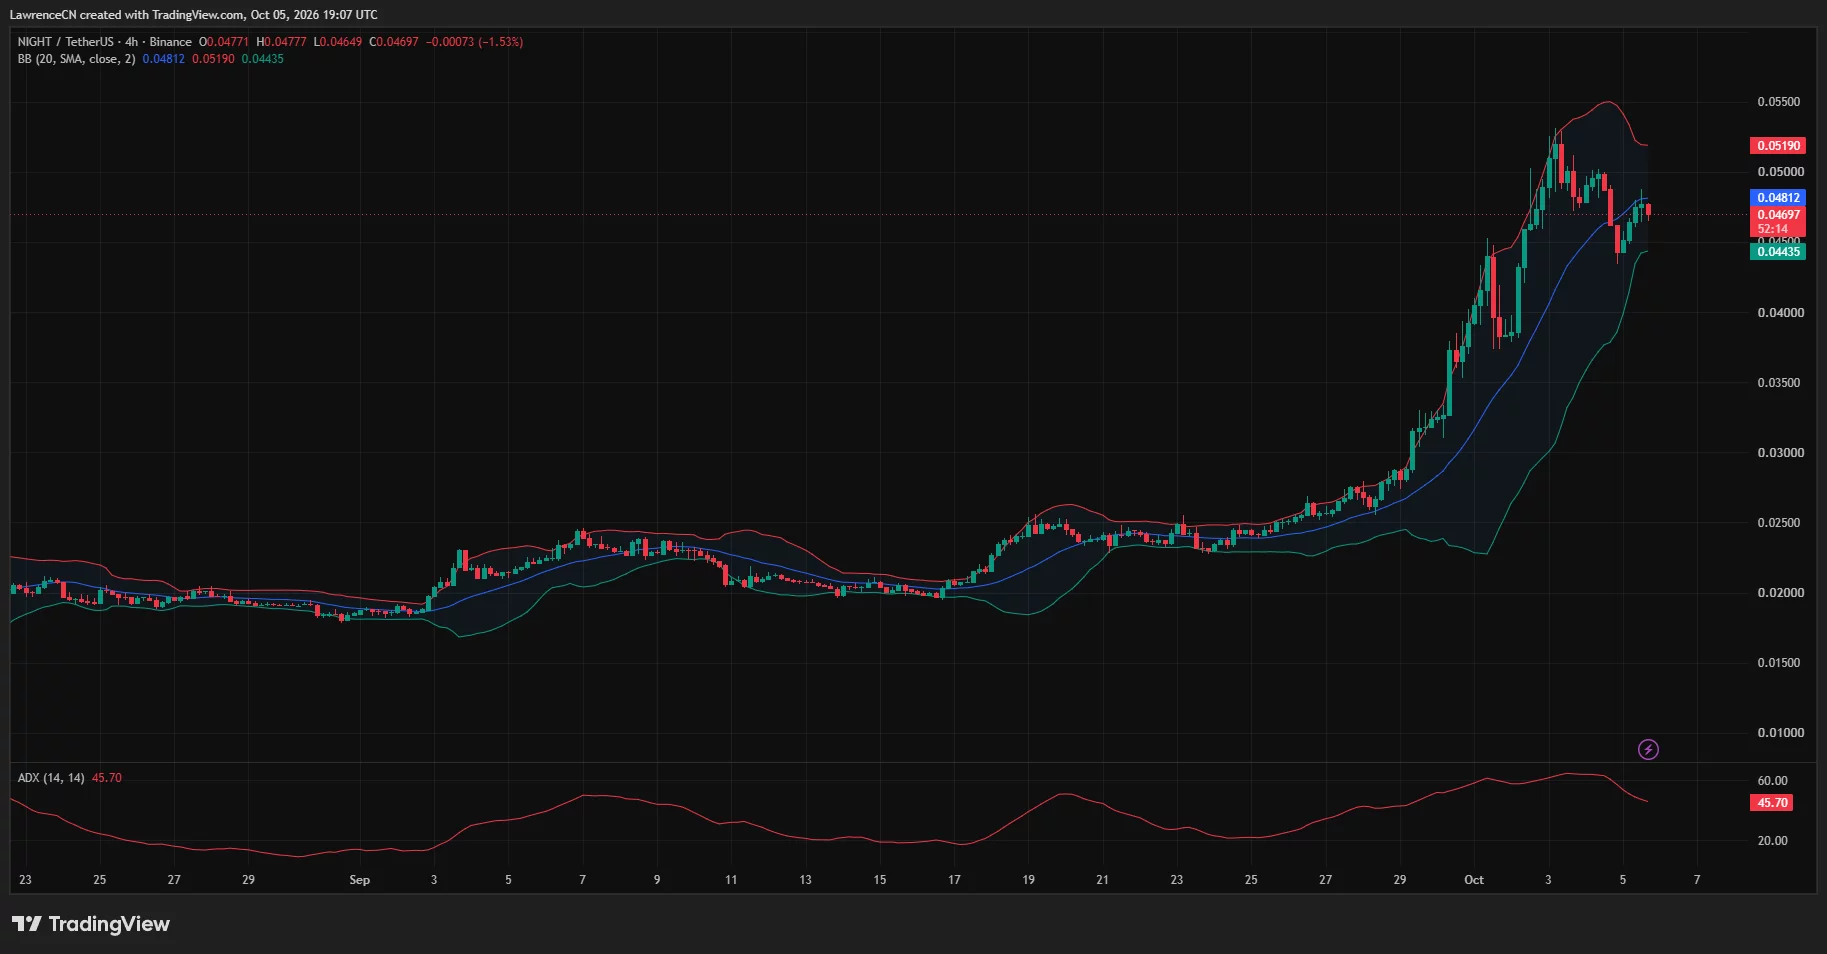
Price has rebounded from the lower-band region but has yet to regain the middle line. A sustained move above $0.0481 would put the $0.050 area and upper band back within reach.
The 4-hour Average Directional Index reads 45.70 after falling from above 60. ADX measures trend strength rather than direction; its decline accompanies the shift from a steep advance to a narrower trading range.
CoinGlass’s one-week liquidation heatmap shows its brightest overhead concentration around $0.052, with further bands around $0.053–$0.0545. Those levels overlap the recent price highs and the upper Bollinger region.
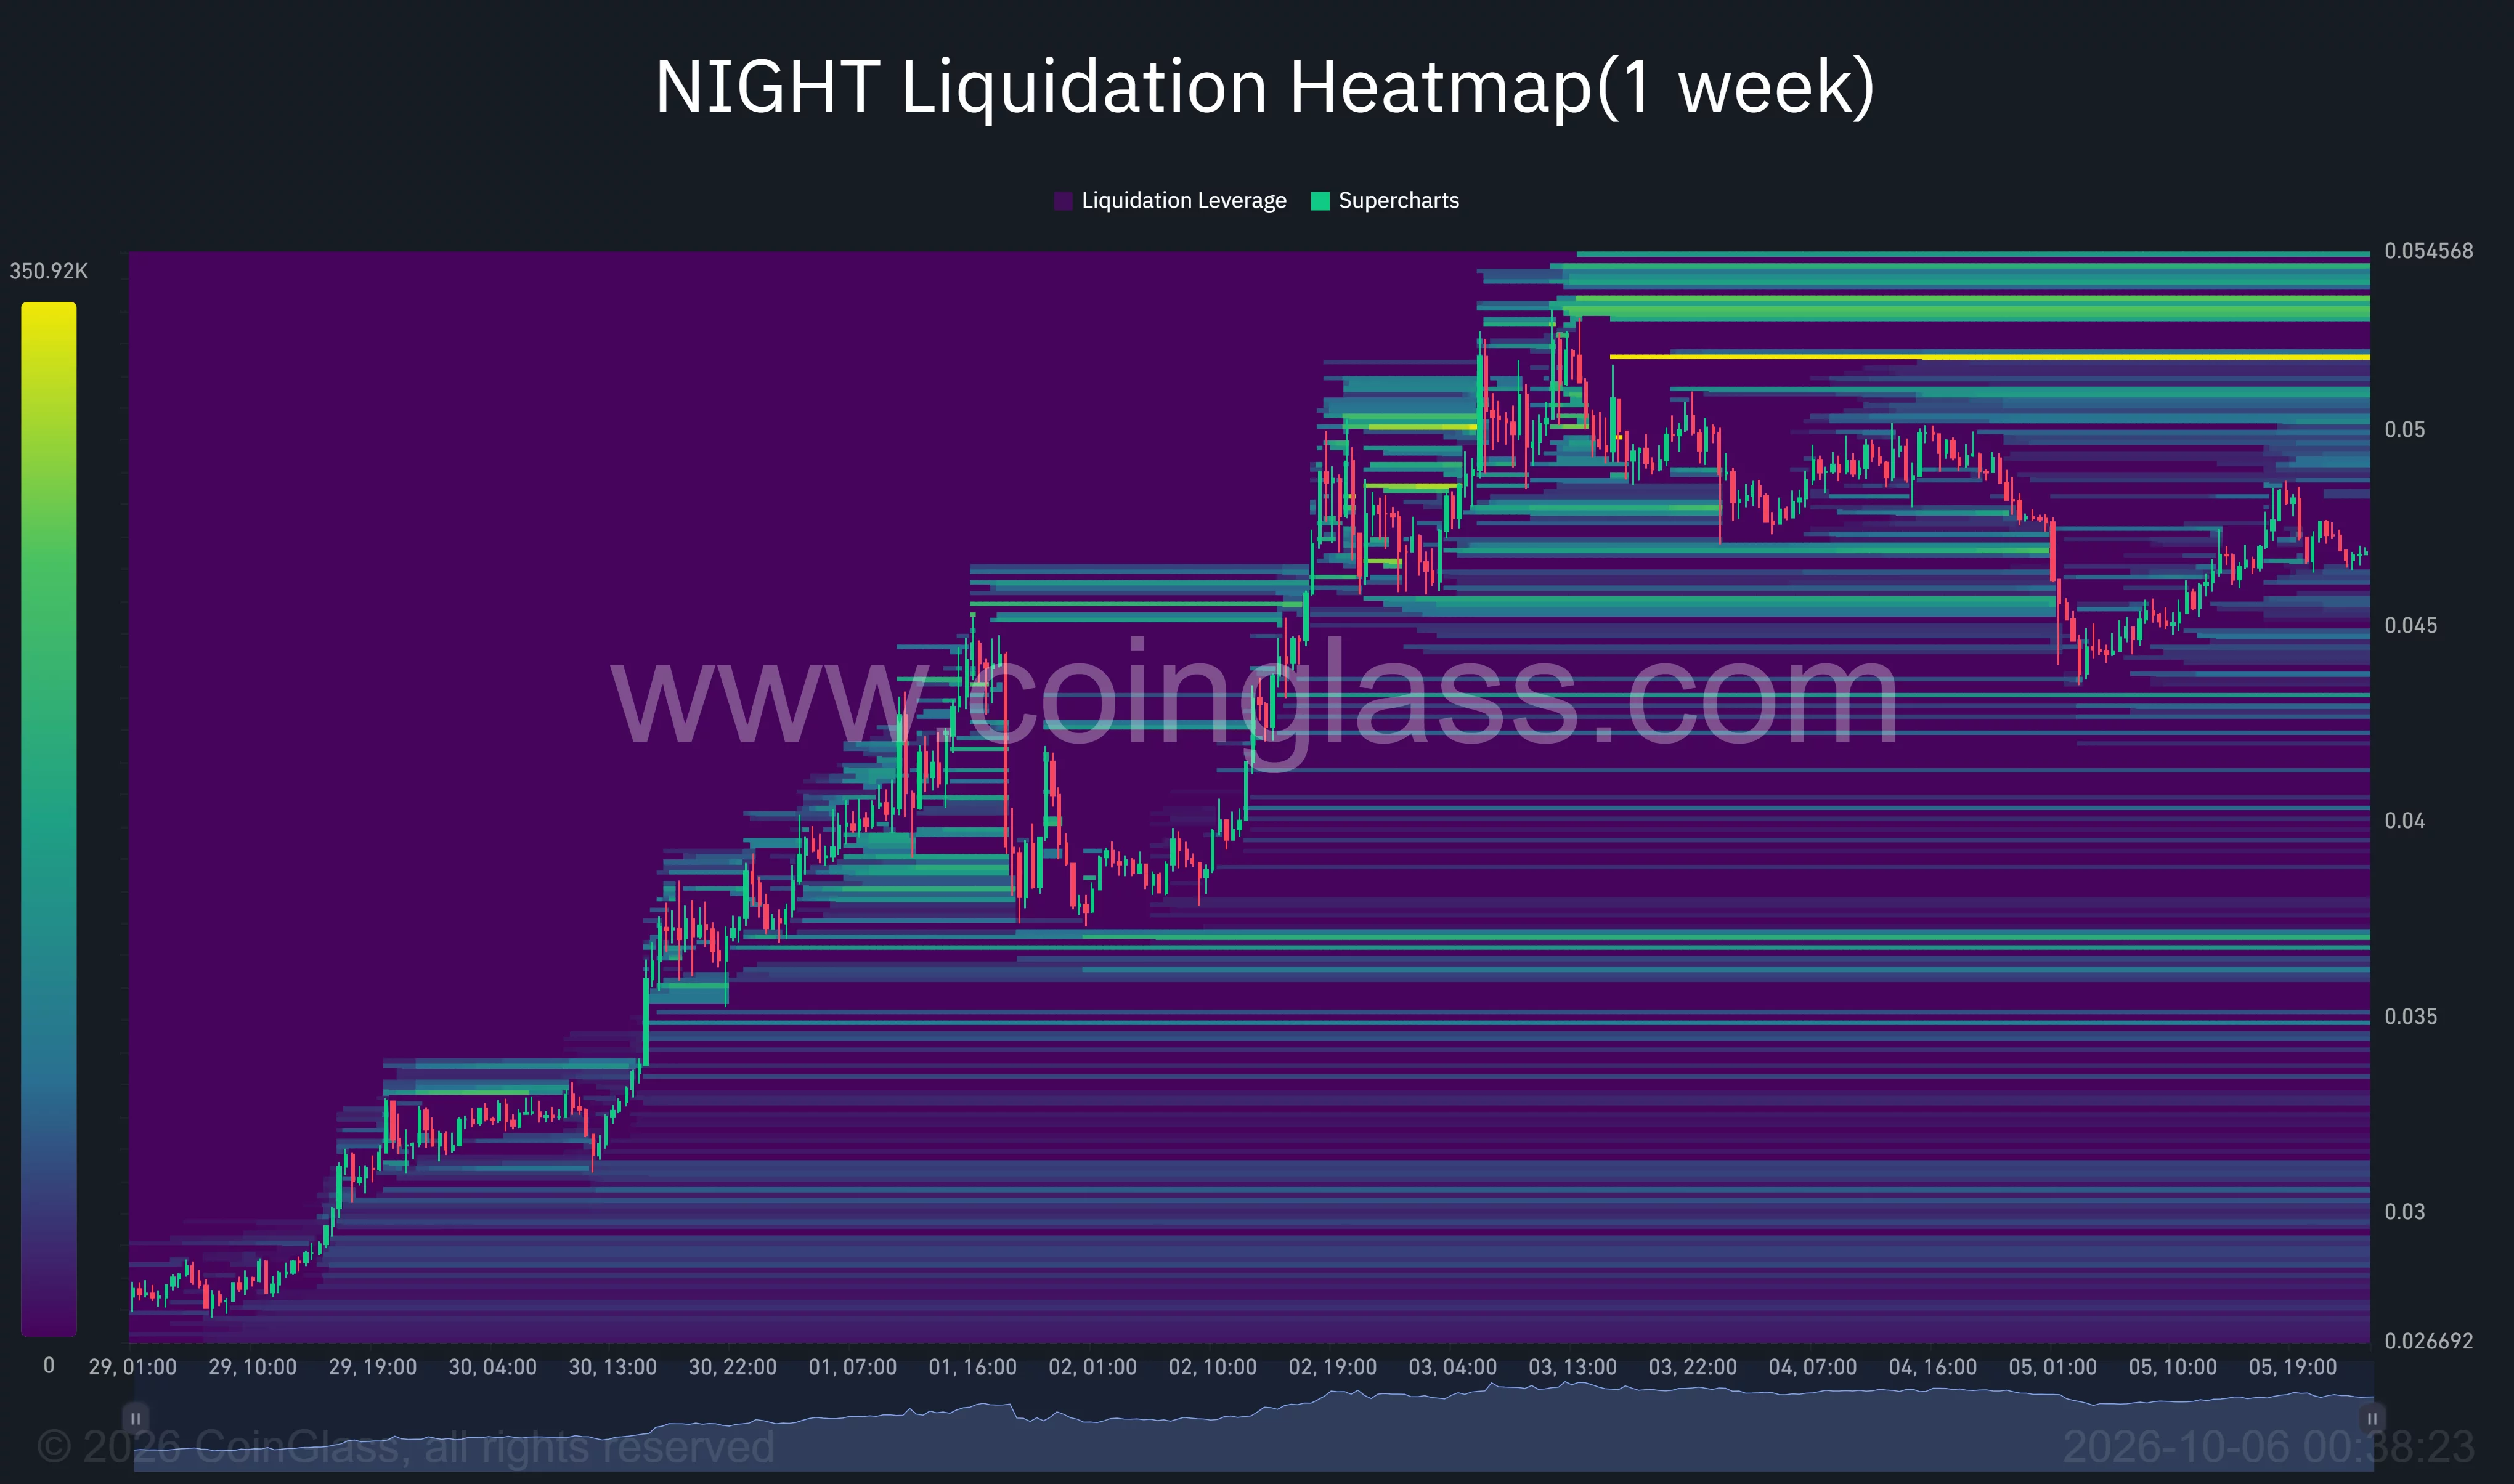
Below the market, visible liquidation concentrations sit around $0.045–$0.046 and $0.043. A move through either side of the range could expose leveraged positions clustered nearby.
The heatmap supports watching those areas for volatility, rather than treating liquidation concentrations as fixed price destinations.
How high can Midnight price go in October?
The first upside scenario requires NIGHT to reclaim $0.0481, move through $0.050, and hold above resistance around $0.052–$0.055. From approximately $0.047, a rise to $0.055 would represent about 17%.
An Oct. 4 technical assessment published on X by market commentator Whale Factor identified a longer-term descending-trendline breakout and placed a Fibonacci level near $0.05879. The commentator projected a possible move beyond $0.10 if momentum and trading volume strengthened.
The $0.05879 level would represent roughly 25% upside from $0.047. The $0.10 projection would require more than a doubling and remains the commentator’s conditional forecast, beyond the nearer resistance visible on the daily and 4-hour charts.
On the downside, a sustained break below $0.044–$0.04435 would weaken the recent rebound. The next chart-based areas to watch would be roughly $0.040 and $0.038, where price traded during the initial October advance.
A deeper reversal would bring the former $0.032 breakout region into focus. For October, the immediate balance remains between defending $0.044 and overcoming $0.052–$0.055 before considering the higher $0.05879 target.
Disclosure: This article does not represent investment advice. The content and materials featured on this page are for educational purposes only.
