
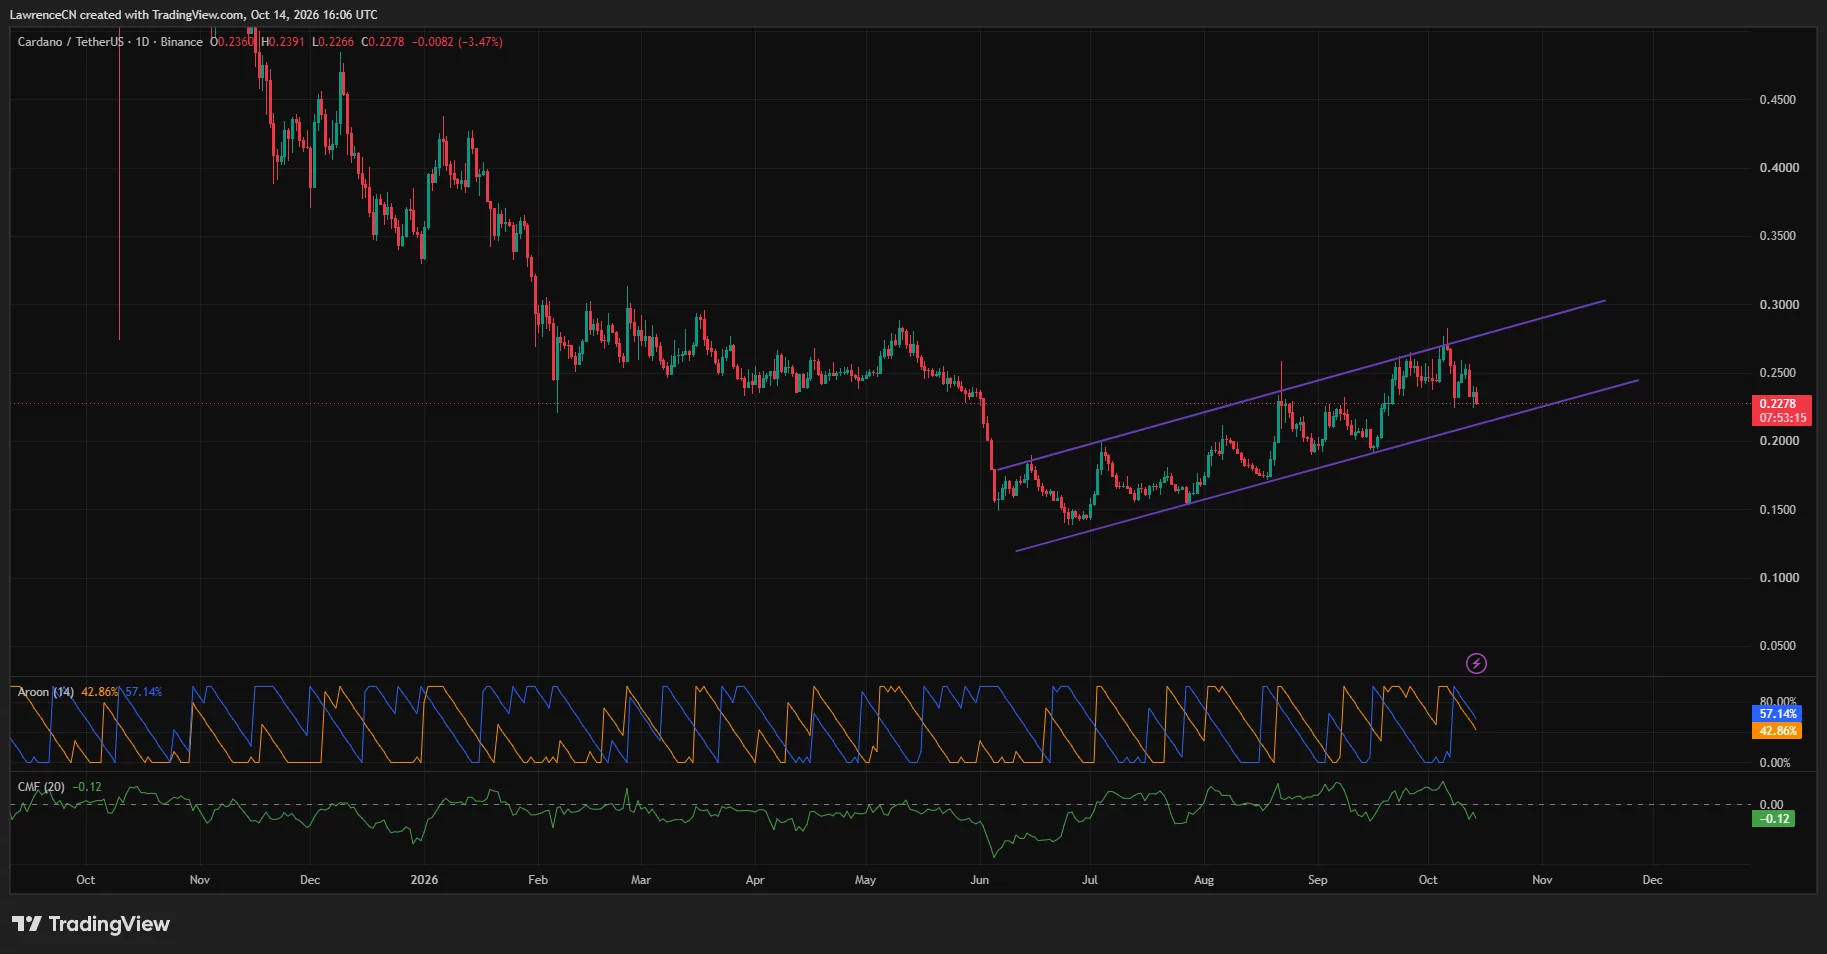
Cardano price has fallen toward $0.228 as daily selling pressure tests its rising channel, while analyst Giannis Andreou sees a possible recovery if ADA holds the $0.22–$0.24 demand zone.
Summary
- ADA traded near $0.228, with TradingView showing a 3.47% decline on the daily chart.
- Daily Chaikin Money Flow stood at −0.12 as price approached the rising channel’s lower boundary.
- Andreou identified $0.2910 as a breakout test after a recovery through $0.26–$0.28.
- CoinGlass showed prominent liquidation concentrations near $0.24, $0.247, and $0.26, above the market price.
Cardano daily price chart showed it was trading at $0.2278 on Oct. 14, below the session’s opening price of $0.2360. The recorded high was $0.2391, while the low reached $0.2266, leaving ADA near the bottom of its daily range.
The weekly chart showed a broader decline of 9.79%, with ADA at $0.2276 against an opening price of $0.2522. Its weekly high stood at $0.2561 and its low at $0.2242, placing the latest price just above that lower level.
Cardano approaches the lower edge of its rising channel
The TradingView daily chart places ADA inside an ascending channel drawn from its June and July lows. Cardano recovered from roughly $0.14 in July to above $0.27 in early October before retreating toward the channel’s lower boundary.
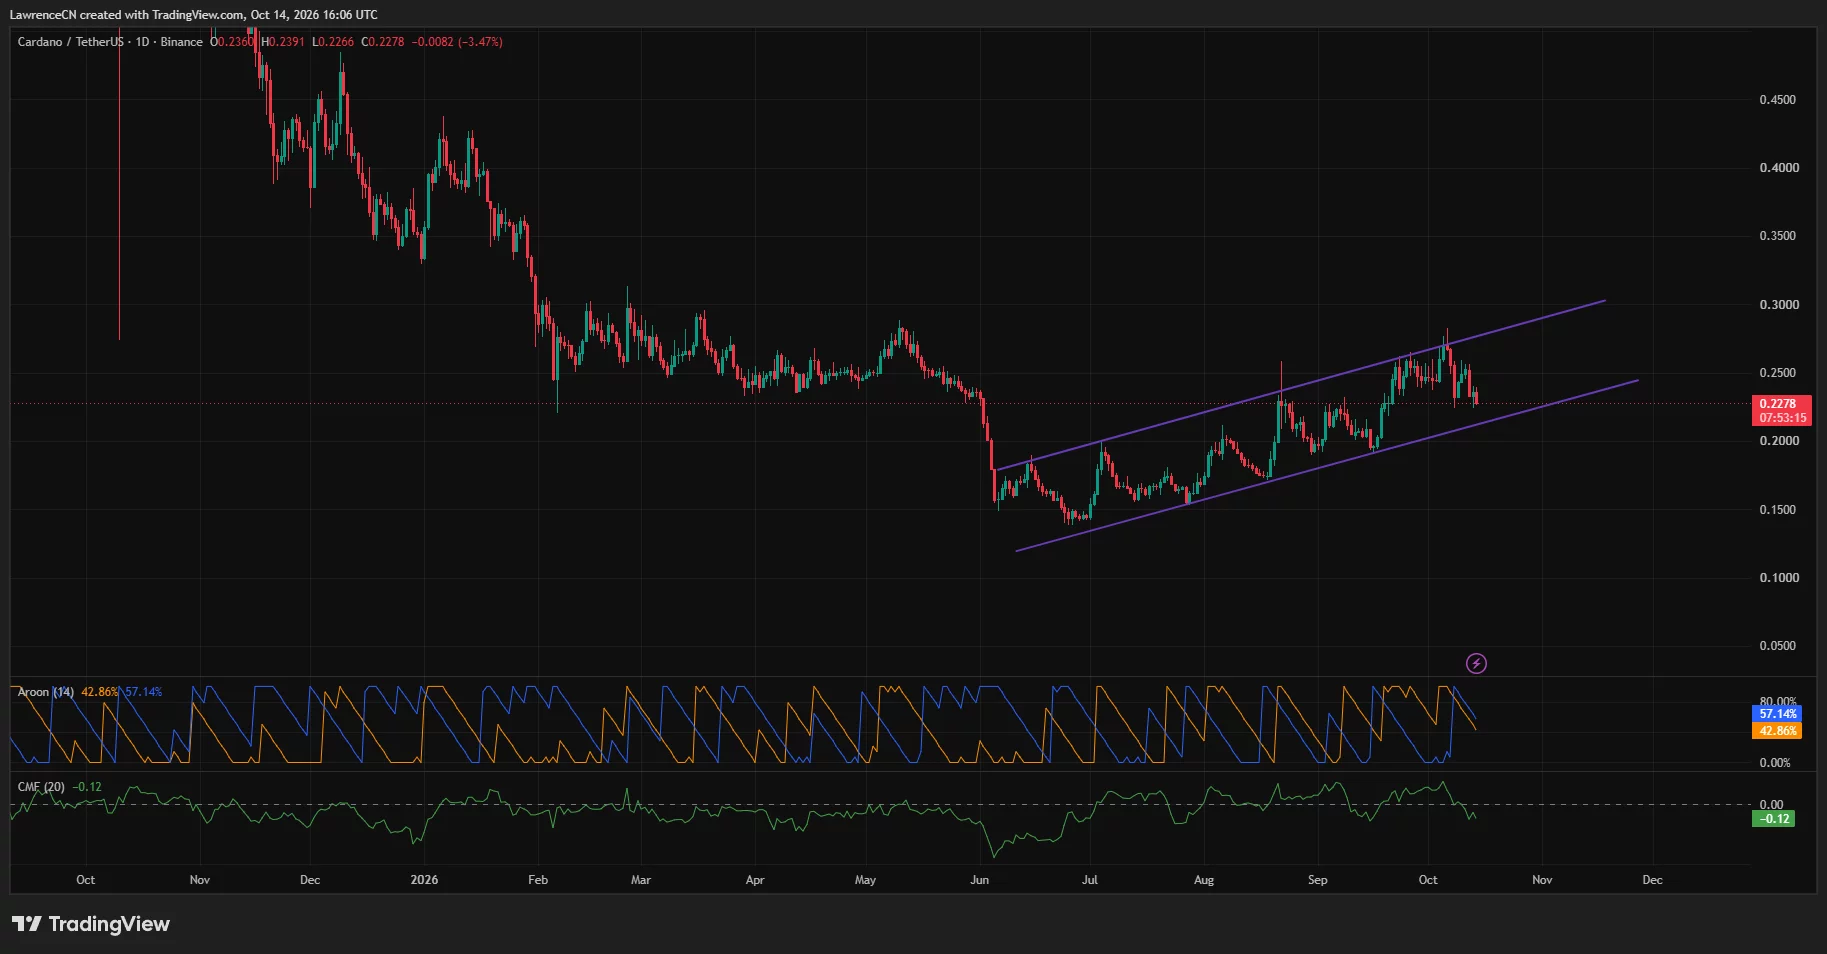
At the latest reading, the drawn lower trendline runs through approximately $0.21–$0.22. ADA remains above that boundary, although its fall from the October peak has narrowed the distance between price and channel support.
The same chart shows several unsuccessful attempts to sustain trading above $0.25 during the recent pullback. A recovery toward that area would first require ADA to regain $0.23–$0.24, where recent daily candles show repeated trading activity.
Daily momentum readings also show a weaker short-term setup. TradingView displays the Aroon lines at 42.86% and 57.14%, with both below their recent peaks near 100%.
The daily Chaikin Money Flow reading is more clearly negative at −0.12. Its move below zero accompanies the latest price decline, following positive readings during parts of September and early October.
Taken together, the daily chart shows a pullback within the recovery channel that began in midyear. A move through the lower boundary would break that drawn structure, while a rebound would keep price inside it.
Andreou’s recovery scenario starts with $0.22–$0.24
Giannis Andreou identified the $0.22–$0.24 area as Cardano’s immediate demand zone in an Oct. 14 post. He placed the 0.618 Fibonacci level near $0.2278, almost exactly matching the latest TradingView daily price.
The analyst said ADA needs to hold that zone and reclaim $0.26–$0.28 before $0.2910 becomes the key breakout test. His scenario therefore requires a recovery through several resistance levels before the higher targets come into play.
A confirmed break above $0.2910, followed by a retest, would bring $0.3206 and $0.3698 into focus, according to Andreou. He listed $0.4277 as the next level beyond those targets.
His illustrated bullish path extends to $0.4834, representing roughly 105% upside from the approximately $0.2354 price shown in his own chart. That percentage belongs to the starting price in his analysis; the Binance daily chart records a lower price near $0.228.
Andreou also outlined the downside conditions. A loss of $0.22 would put $0.2110 and the $0.19–$0.20 support area in focus, he said.
His $0.22 threshold sits close to the lower boundary of the separate daily ascending channel. Both chart setups place the next downside test beneath the current price, while his bullish path begins with holding that area.
Weekly Supertrend remains above ADA’s price
TradingView’s weekly chart shows the Supertrend indicator at $0.2762, above ADA’s $0.2276 reading. The indicator remains red, maintaining a bearish weekly signal despite the recovery from the midyear lows.
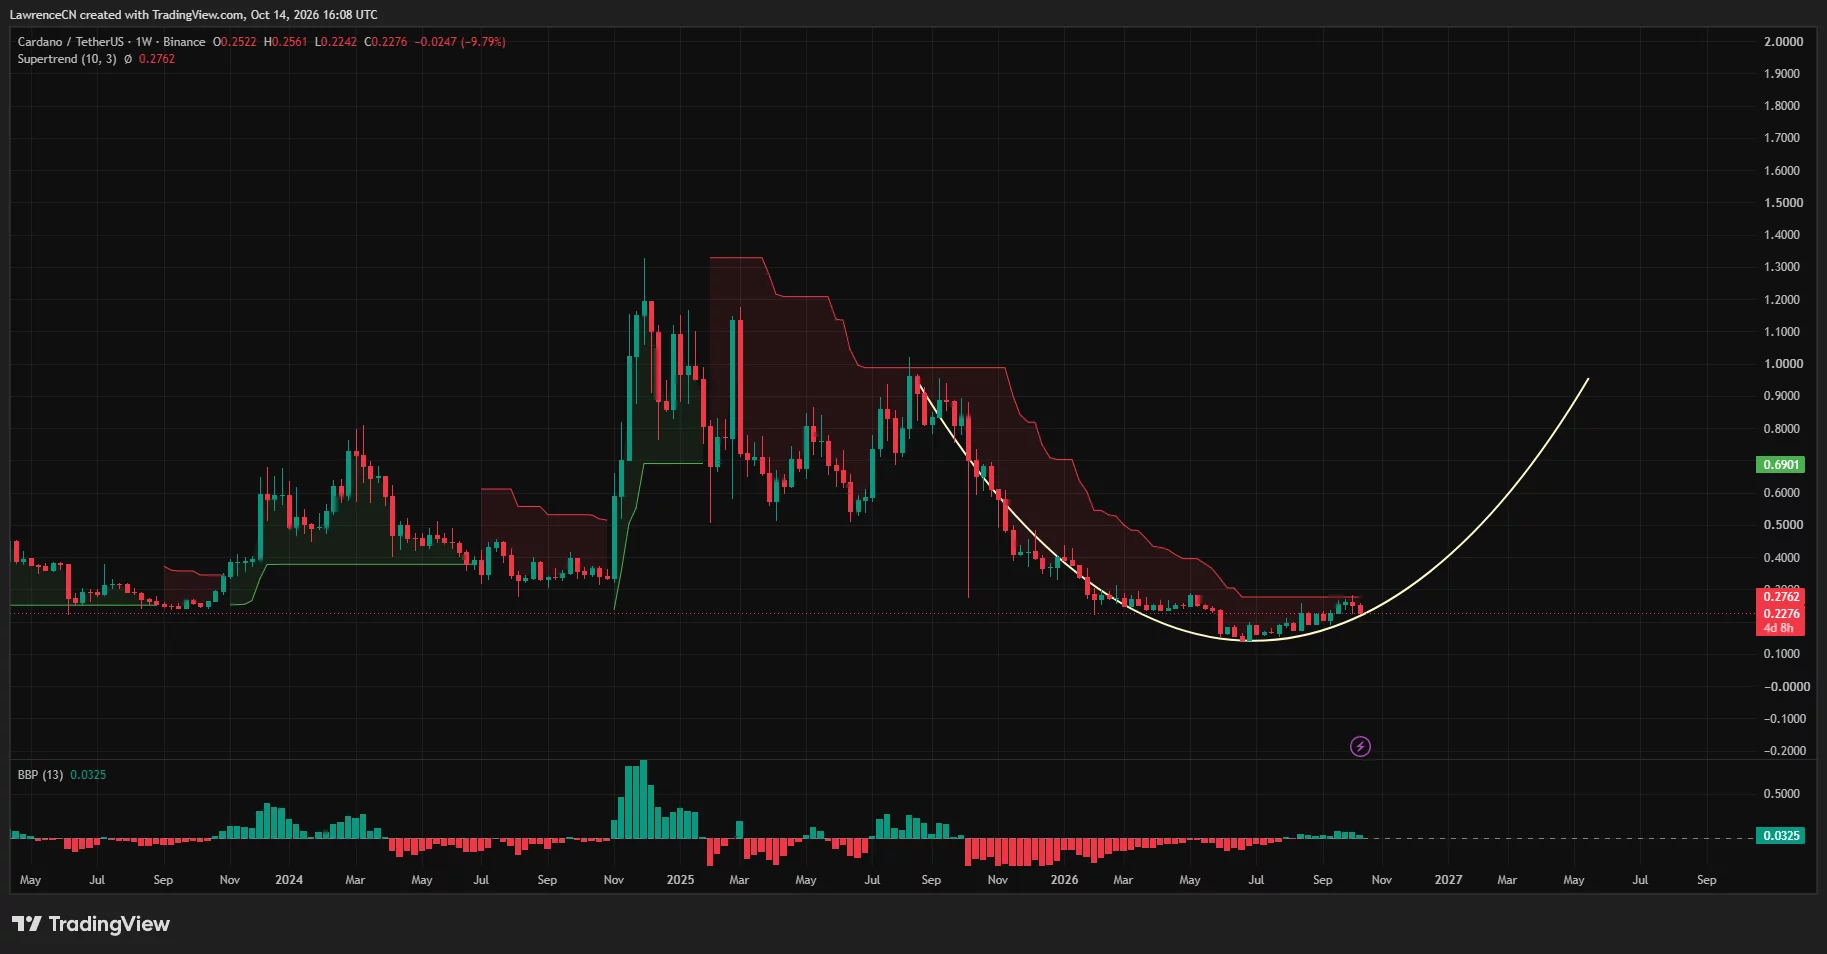
The Supertrend level also falls inside Andreou’s $0.26–$0.28 reclaim zone. A move into that range would bring ADA back toward both the analyst’s recovery threshold and the weekly indicator.
Weekly Bull Bear Power stood at a positive 0.0325. The latest green histogram bars follow a lengthy stretch of mostly negative readings, creating a mixed picture alongside the red Supertrend.
The weekly chart also contains a drawn rounded recovery path that extends upward into 2027. ADA’s observed price remains near the lower portion of that illustration, beneath the Supertrend line and far below the curve’s projected endpoint.
For U.S. holders following the dollar value of ADA, the quoted readings come from Binance’s USDT trading pair. Andreou’s price levels are also dollar-denominated, giving his recovery and downside scenarios the same approximate price reference as the technical charts.
Liquidation bands cluster above the market
CoinGlass’s one-week ADA liquidation heatmap shows the price retreating from around $0.255 toward $0.227 across the displayed period. The path includes rebounds toward $0.255 that failed to hold before the latest decline.
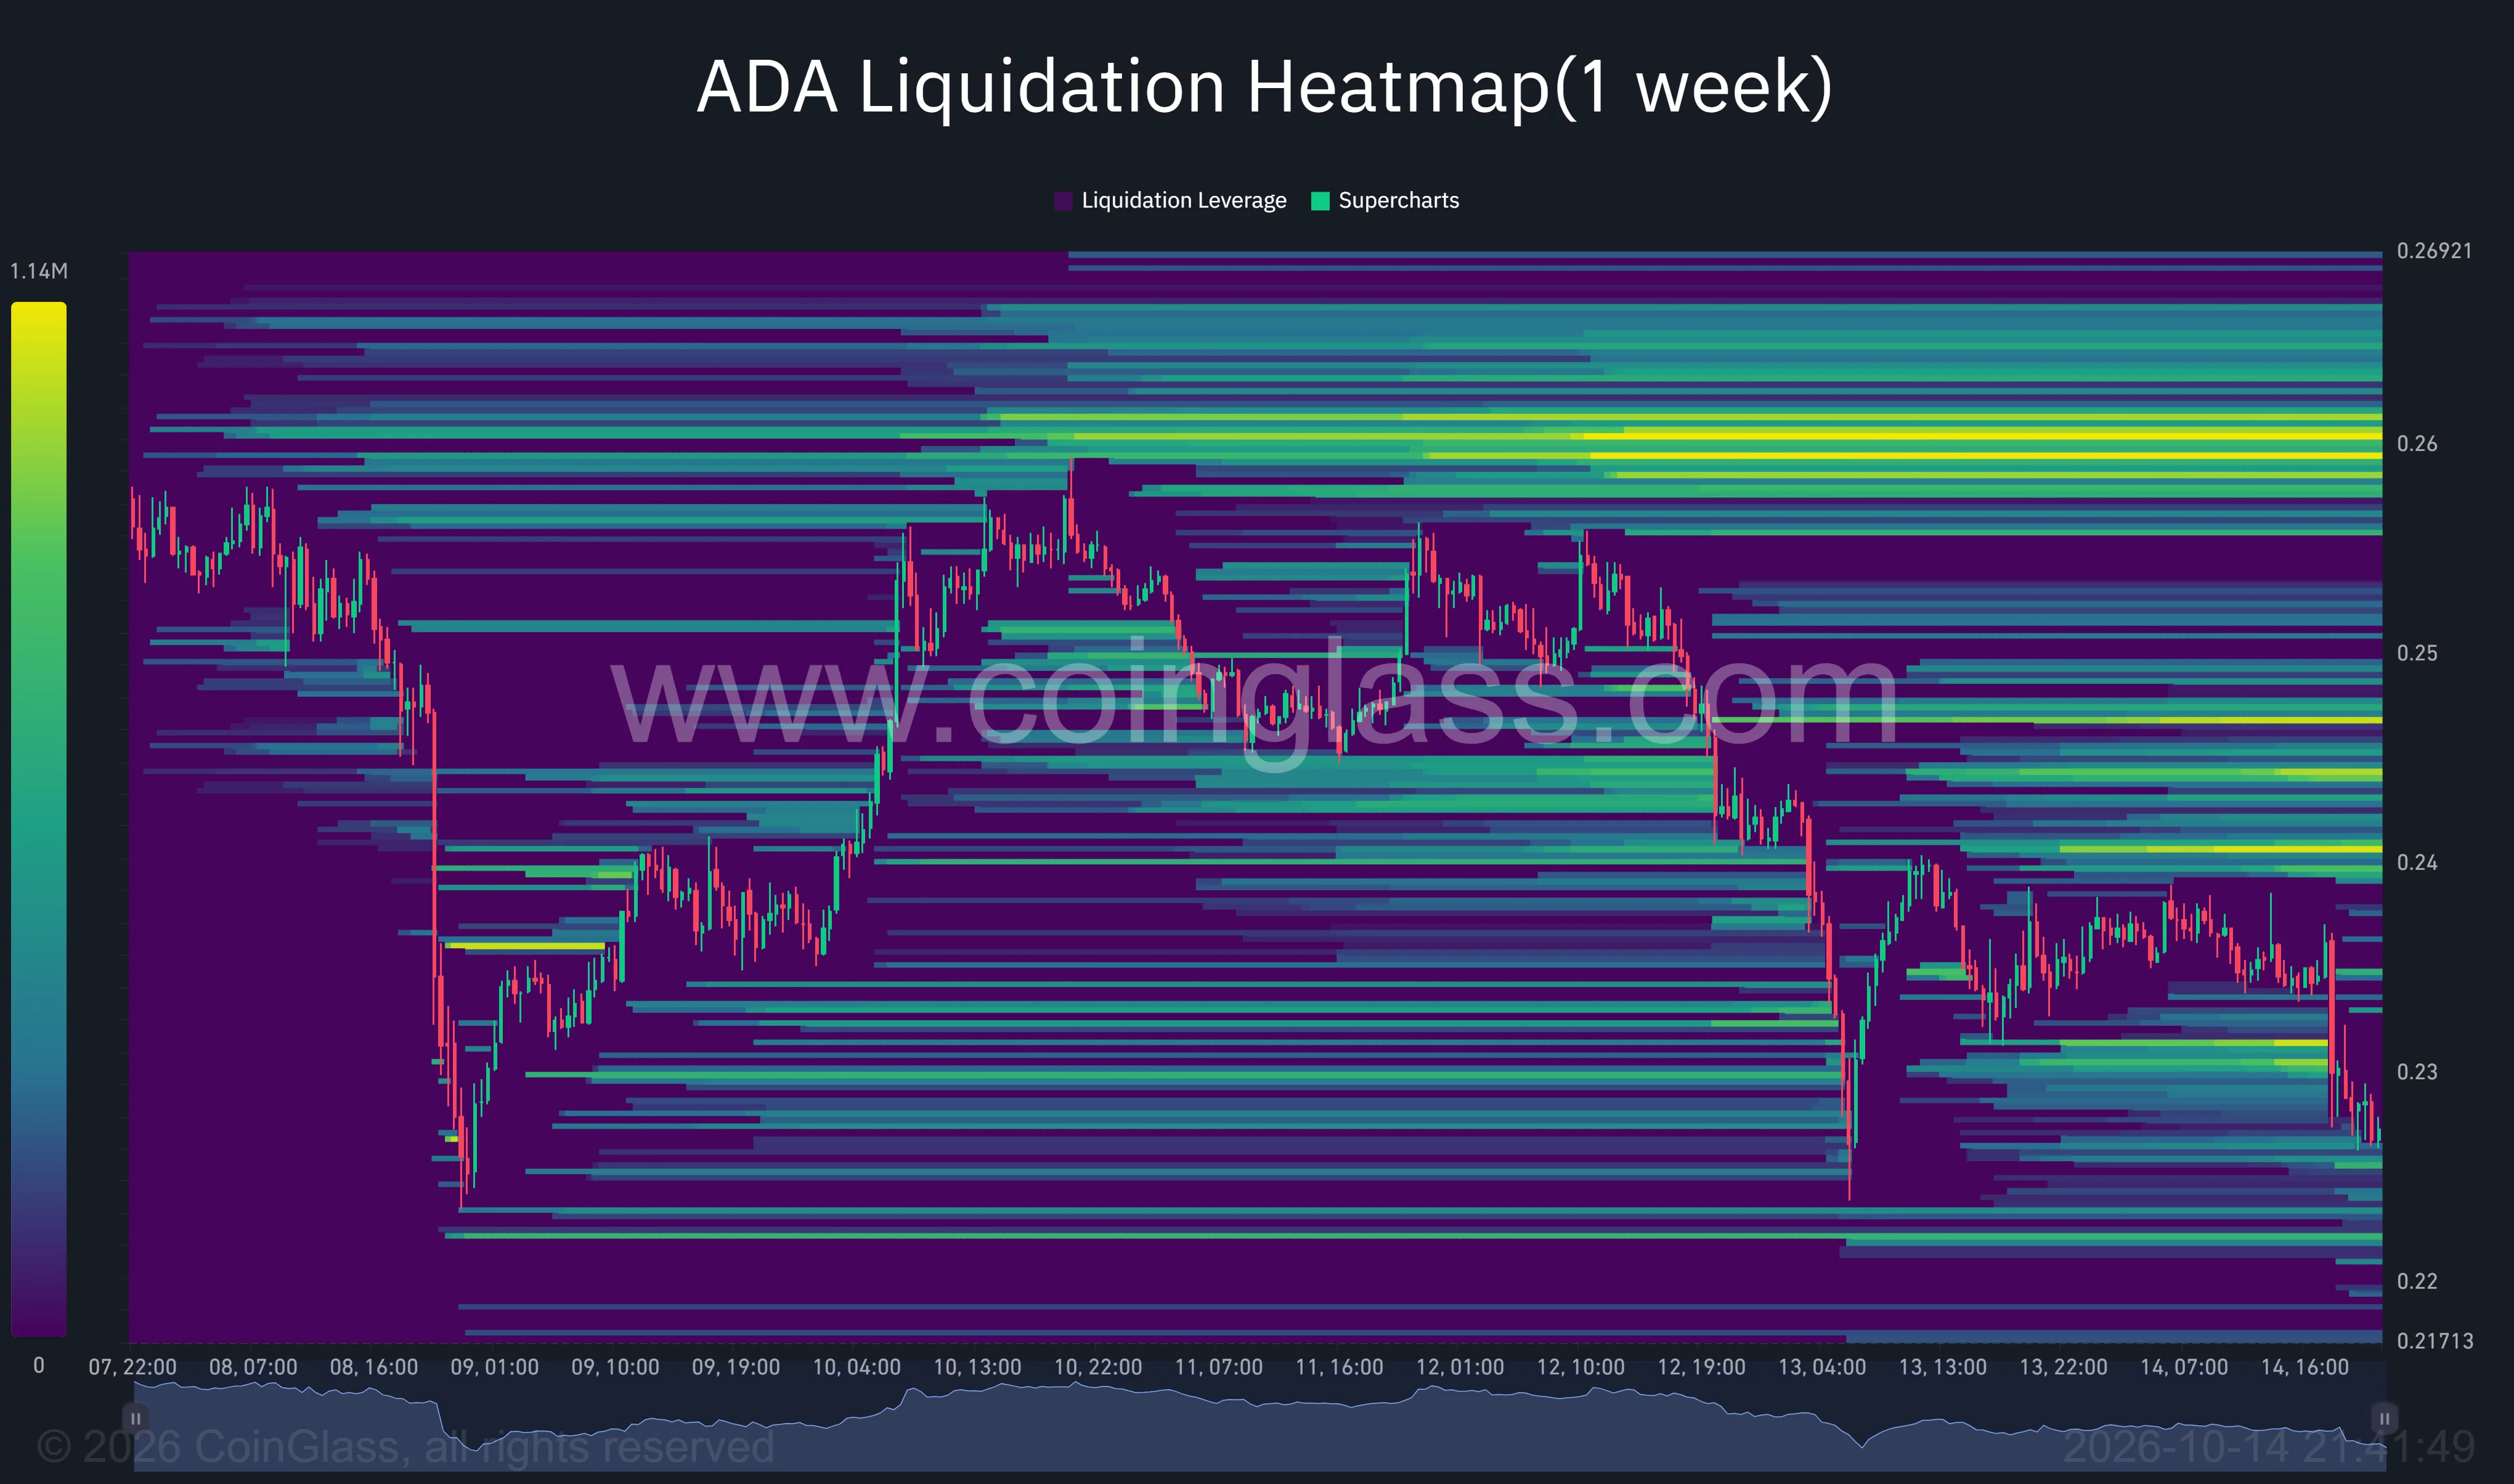
At the right edge of the heatmap, visible liquidation bands sit near $0.23–$0.233 and approximately $0.24. Higher concentrations appear around $0.244–$0.247, with the strongest broad band near $0.26.
The $0.26 concentration overlaps the lower end of Andreou’s proposed reclaim zone. His next resistance range extends toward $0.28, close to the weekly Supertrend reading of $0.2762.
Below the latest price, CoinGlass shows bands around $0.223–$0.225 and near $0.22. Those levels sit close to the weekly low and Andreou’s stated downside threshold.
ADA consequently enters the next trading stretch near $0.228, with daily channel support below it and the weekly Supertrend overhead. Andreou’s recovery scenario requires the $0.22–$0.24 zone to hold before a reclaim of $0.26–$0.28 opens the way toward his $0.2910 breakout test.
Disclosure: This article does not represent investment advice. The content and materials featured on this page are for educational purposes only.
