

During the past 3 months, Polkadot was one of the main performers after gaining by 130%. The price of DOT, one of the leading altcoins, down by 3.6% during the past 24 hours. This shows that it has maintained its go-dowm momentum despite other cryptocurrencies losing much within the period. Generally, DOT has benefited from the euphoria surrounding Trump’s victory and the prospect of a new SEC chairperson. At press time, trade DOT’s perpetual contract at $4.89 DOT/USDT on Gate.io. The graph below shows DOT’s current price outlook.

DOT Weekly Price Chart- Gate.io
As observed on the graph, DOT is within a bullish trend which started on 26 November. One reason DOT is trending is the positive news and reviews it has been receiving since mid-November. For instance, the news surrounding Polkadot 2.0 has created much positive sentiment among DOT investors.
Analyst Predicts Sustained DOT Bullish Market
Apart from the existing bullish momentum some analysts have predicted that the altcoin’s buying pressure will likely increase in the future. Gate.io predicts that DOT may sustain its bullish outlook if its price remains above $8.60 DOT/USDT. The analyst anticipates it to retest this critical support level before rising towards its all-time high of $55, attained in 2021. His perception is that if the cryptocurrency maintains that level into March there will be a high likelihood of a sharp price spike during the month. DOT’s closest target in December is $12.61.
DOT Market Outlook
As hinted earlier, Polkadot is within a bullish run. The market anticipates the rally to continue until the end of the year. Several key indicators such as the moving averages also confirm that DOT is within a bullish run.
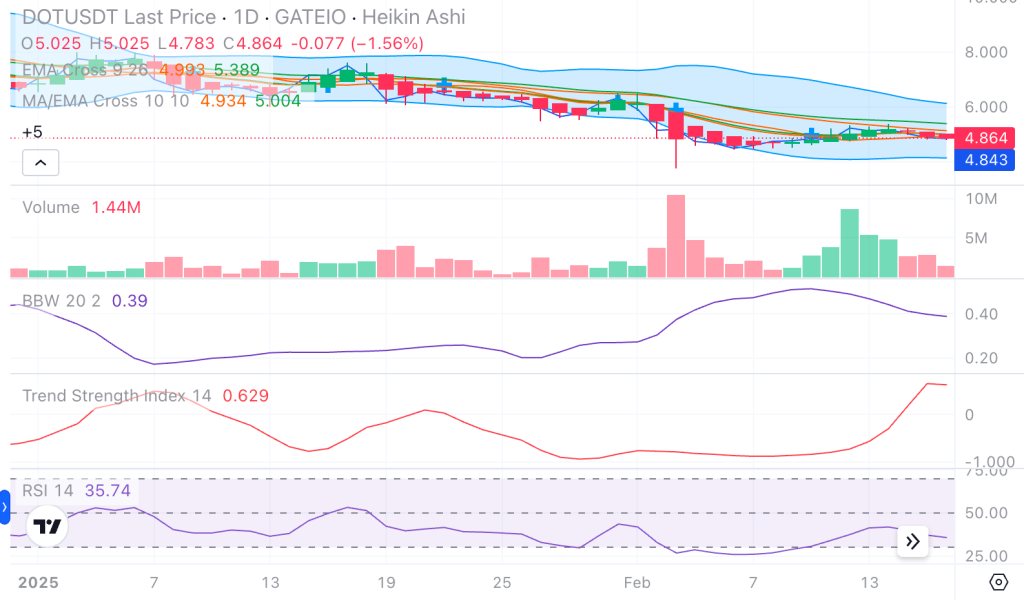
DOT Weekly Price Chart – Gate.io
Probably, one of the first things you notice when you look at the above image is the golden cross that formed on DOT’s weekly chart. The golden cross is formed when the 50-day EMA crosses above the 200-day EMA. No doubt, this is a bullish signal. Therefore, the market may expect its price to continue in its upward trajectory for the next few days or weeks. Another impressive thing is that the DOT trading volume has been very high during the past several days. That indicates the buyer’s appetite for the asset. The Bollinger Bands and the ADX also show that DOT is bullish.
As you see in the image above the Bollinger Bands shows much volatility and momentum as it is widening at the moment. Its upper band is at $9.839 while its lower boundary has a reading of $3.76. Therefore, if DOT breaks above the Bollinger Bands once more its price would be surging towards $10. Also, the ADX has a reading of 55.33 which indicates high volatility. When an asset has high volatility its price increases significantly if there is a rise in the buying activity.
However, it seems that DOT is forming a parabolic curve which shows a strong price rally. However, that may also have a danger of a sharp fall in its value should the buying pressure decrease and the selling momentum increase. The best scenario is to see the cryptocurrency getting into a sideways market. If that happens it may gather much more momentum for another price spike.
The Potential and Future of Polkadot
Polkadot is one blockchain that creates value for the crypto ecosystem through enhancing interoperability among different blockchains. Its main function is to transfer data and wealth among blockchains. For example, it enhances data sharing between independent blockchains such as Ethereum and bitcoin. Polkadot which was launched in August 2020 enhances a heterogeneous multi-chain architecture system. Due to its uniqueness many developers are interested in creating their blockchain networks on it. Apart from its functionalities, the blockchain is known for its speed, scalability and security.
Polkadot’s native cryptocurrency, DOT, has many functions within the ecosystem. First, DOT is the network’s governance token, a reason why it is in high demand. This also means that it has much significance now and in the future. Secondly, the network validators stake the token in order to verify transactions on the blockchain. This means that DOT has utility. More importantly, DOT is tradable on various exchanges that include Gate.io, Coinbase and Binance. For example, on Gate.io DOT is paired with Bitcoin, USDT and TRY.
As said earlier, the team is working on Polkadot 2.0 which includes the addition of several upgrades. Polkadot 2.0 will boost the network’s scalability and security. It will also improve the staking mechanisms which will likely attract more DOT investors. The recent surge in the DOT price indicates that many investors are interested in the cryptocurrency. Due to these developments some analysts have forecasted the DOT price to increase remarkably during the year. As an example, Toni Bitcoin has predicted that the DOT price may reach $15 DOT/USDT before 20 May 2025. Considering the coin’s current value there is a high possibility that it may surge towards the mentioned amount within the cited period.