This year, the Pi Network price has been in a strong downward trend as buyers remain on the sidelines.
Pi Coin (PI) token initially surged to nearly $3 after its mainnet launch in February. It then embarked on a strong sell-off to the current $0.7925, costing investors billions.
There are three main reasons why the Pi Network price has crashed this year. First, while the mainnet launch was highly successful, most mainstream exchanges have not listed it.
The biggest surprise is Binance, the industry’s biggest crypto exchange. Over 85% of participants in a Binance poll favored listing the coin in February.
Other popular exchanges, such as Coinbase, Bybit, Kraken, and Upbit, have also not listed Pi Network. Bybit’s CEO has argued that Pi Network is a scam, allegations that the developers have rejected.
On the positive side, some of these exchanges are likely to list the token later this year. Pi has become one of the biggest cryptocurrencies, with a market cap of over $8 billion.
An exchange listing by these companies would help to push its price higher. For example, the Orca token price surged by over 200% after being listed on Upbit, the biggest South Korean exchange.
The Pi Network price has also crashed because of future dilutions as token unlocks rise. Data shows that Pi tokens worth millions of dollars will be unlocked each month, and over 1.6 billion tokens will be unlocked in the next twelve months. Token unlocks dilute existing holders.
Further, Pi coin price has dived because of the ongoing crypto market crash. Bitcoin (BTC) and most altcoins have all slumped in the past few months as concerns about Donald Trump’s tariffs remain.
Pi Network price analysis

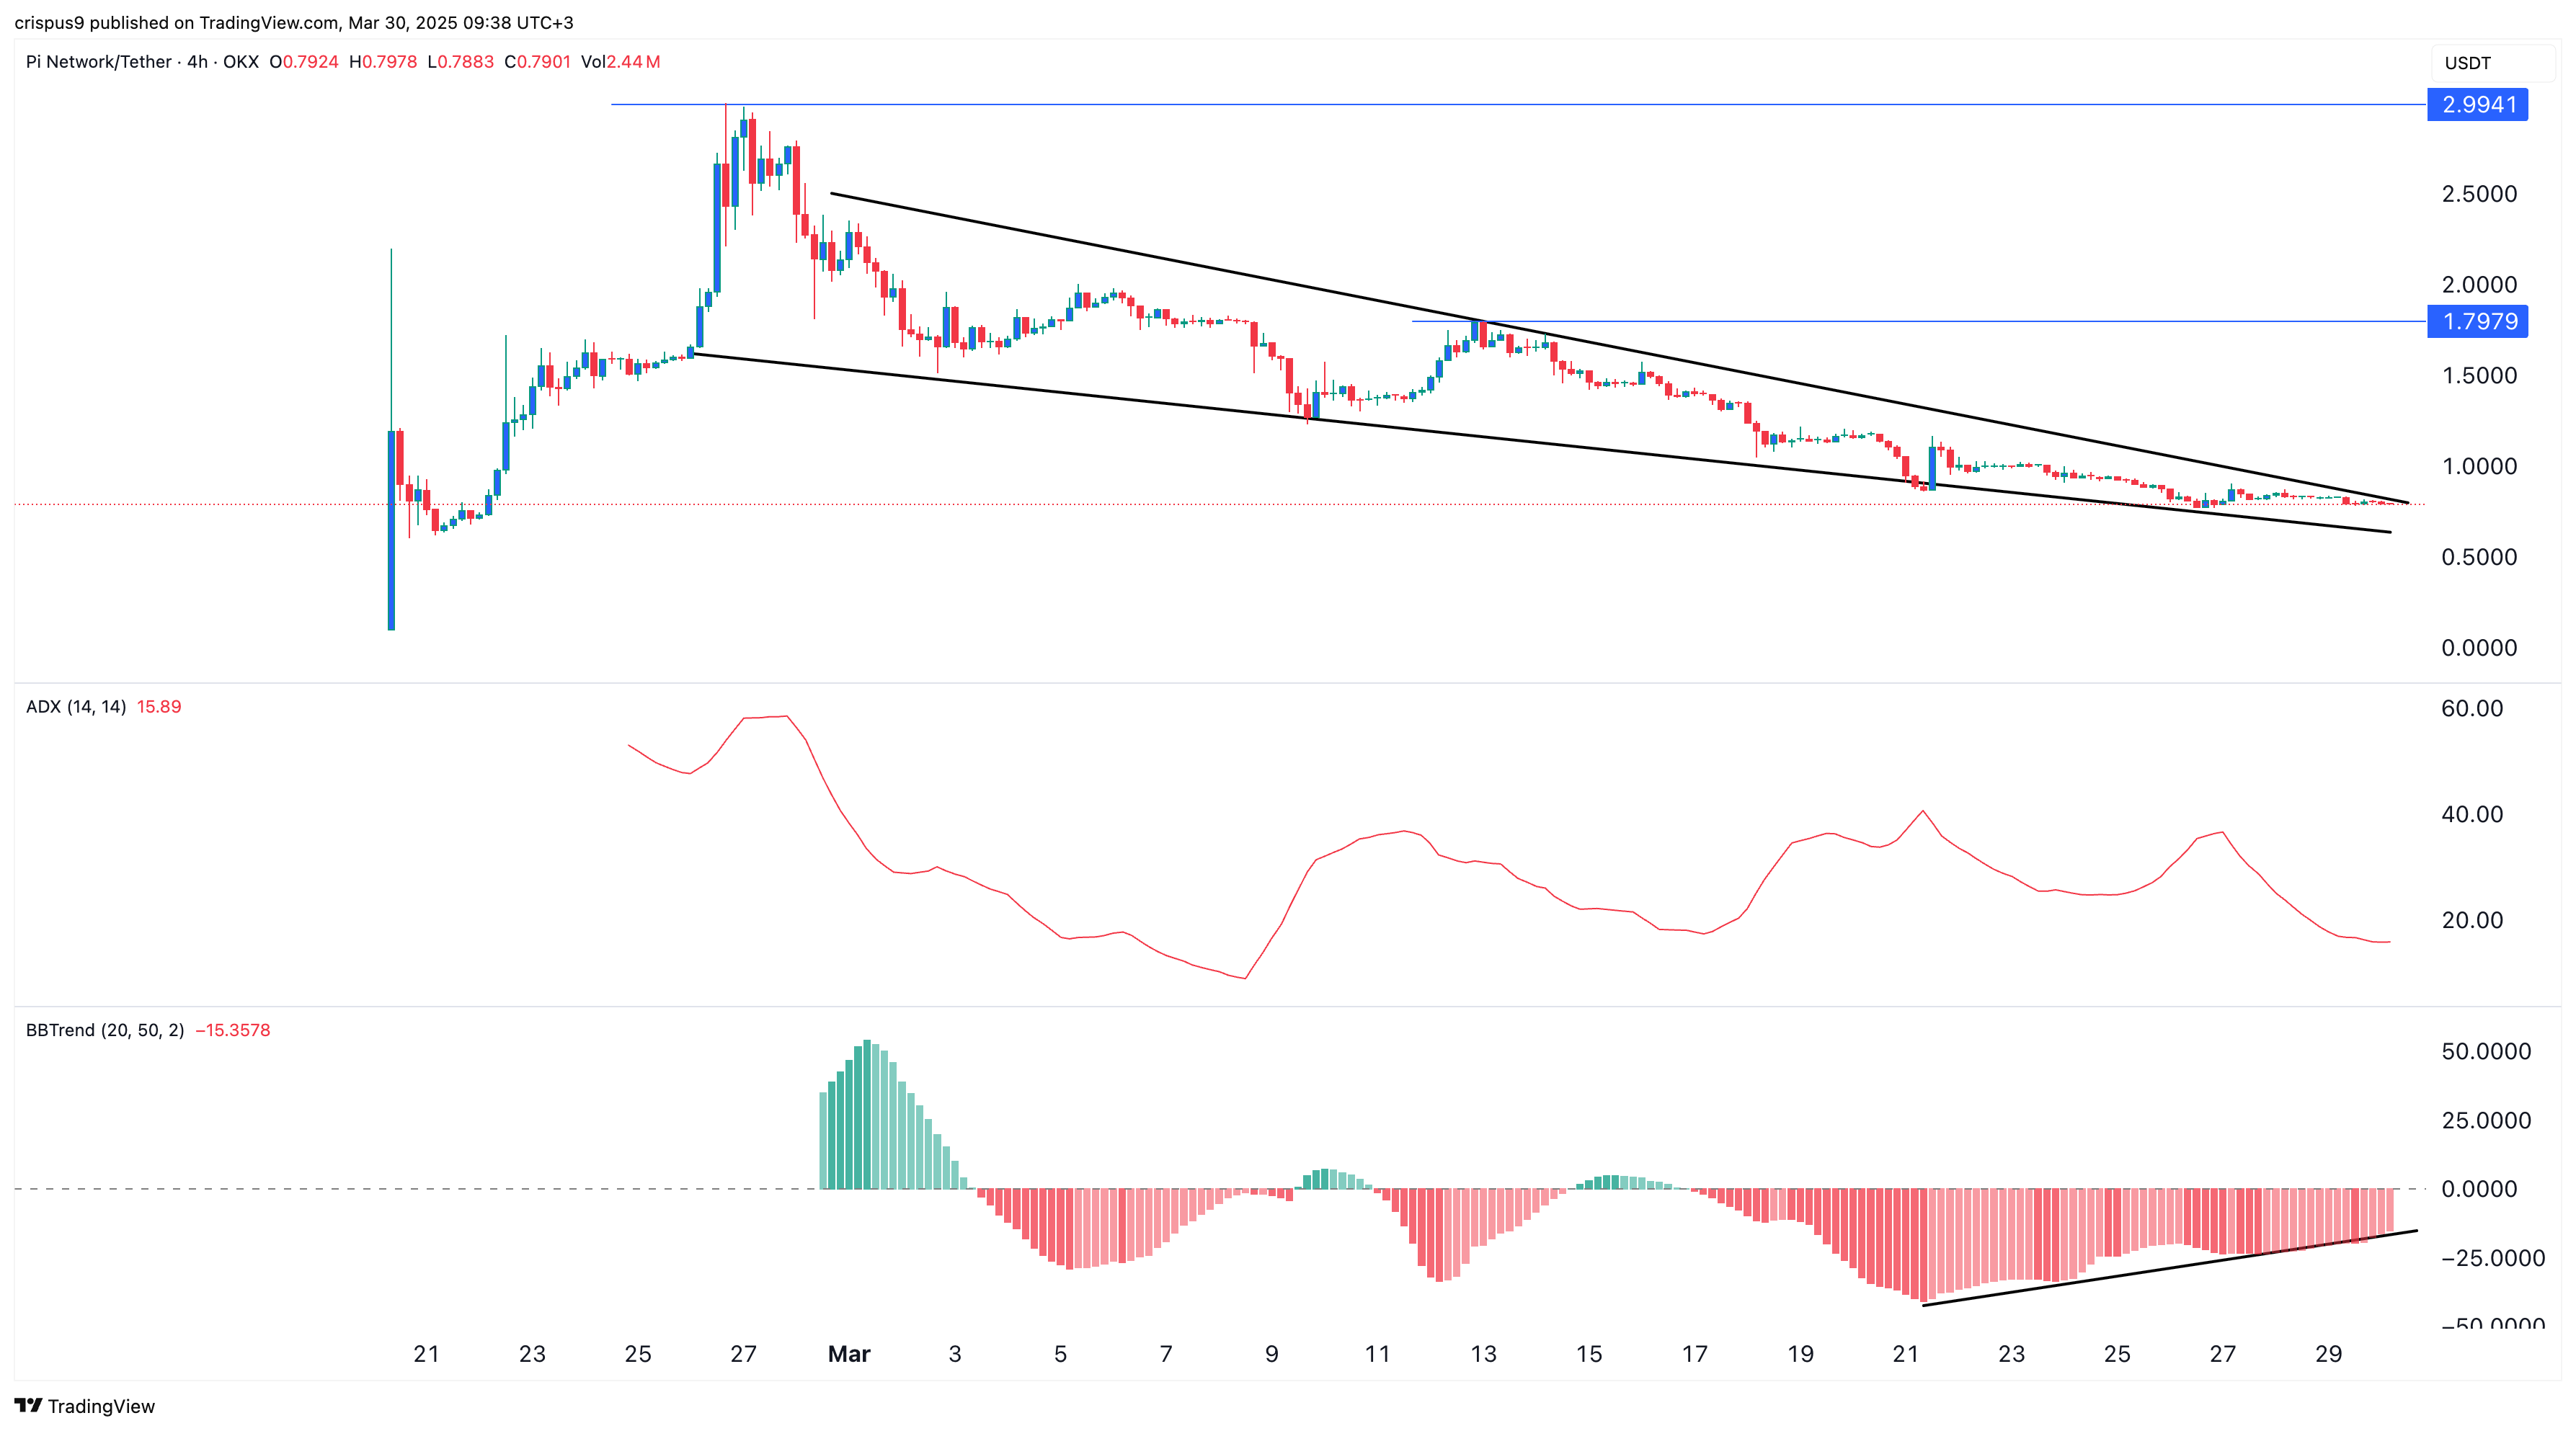
The four-hour chart shows the Pi Network price has crashed in the past few weeks as buyers remained on the sidelines.
On the positive side, there are signs that the sell-off is losing momentum. This explains why the Average Directional Index, or the ADX, has crashed to 15 from last month’s high of near 60. The ADX measures the strength of a trend.
Further, the BBTrend indicator has formed a bullish divergence pattern. This indicator measures the spread of the upper and lower sides of the Bollinger Bands.
All this happens as the two lines of the falling wedge pattern near their confluence point. A wedge is one of the most bullish reversal patterns in technical analysis.
Therefore, the Pi coin price will likely have a strong bullish breakout in April, with the next point to watch being at $1.7980, up by 127% from the current level.

