
BTC USD price had a much-needed stable weekend, even a little bullish. Is it too early to celebrate? Investors and traders alike should have predetermined decision rules when it comes to buying or selling. And their actions shape the
.cwp-coin-chart svg path {
stroke-width: 0.65 !important;
}
.cwp-coin-widget-container .cwp-graph-container.positive svg path:nth-of-type(2) {
stroke: #008868 !important;
}
.cwp-coin-widget-container .cwp-coin-trend.positive {
color: #008868 !important;
background-color: transparent !important;
}
.cwp-coin-widget-container .cwp-coin-popup-holder .cwp-coin-trend.positive {
border: 1px solid #008868;
border-radius: 3px;
}
.cwp-coin-widget-container .cwp-coin-trend.positive::before {
border-bottom: 4px solid #008868 !important;
}
.cwp-coin-widget-container .cwp-coin-price-holder .cwp-coin-trend-holder .cwp-trend {
background-color: transparent !important;
}
.cwp-coin-widget-container .cwp-graph-container.negative svg path:nth-of-type(2) {
stroke: #A90C0C !important;
}
.cwp-coin-widget-container .cwp-coin-popup-holder .cwp-coin-trend.negative {
border: 1px solid #A90C0C;
border-radius: 3px;
}
.cwp-coin-widget-container .cwp-coin-trend.negative {
color: #A90C0C !important;
background-color: transparent !important;
}
.cwp-coin-widget-container .cwp-coin-trend.negative::before {
border-top: 4px solid #A90C0C !important;
}
![]()
Bitcoin
2.85%
![]()
Bitcoin
BTC
Price
$111,038.88
2.85% /24h
Volume in 24h
$56.63B
<!–
?
–>
Price 7d
// Make SVG responsive
jQuery(document).ready(function($) {
var svg = $(‘.cwp-graph-container svg’).last();
if (svg.length) {
var originalWidth = svg.attr(‘width’) || ‘160’;
var originalHeight = svg.attr(‘height’) || ’40’;
if (!svg.attr(‘viewBox’)) {
svg.attr(‘viewBox’, ‘0 0 ‘ + originalWidth + ‘ ‘ + originalHeight);
}
svg.removeAttr(‘width’).removeAttr(‘height’);
svg.css({‘width’: ‘100%’, ‘height’: ‘100%’});
svg.attr(‘preserveAspectRatio’, ‘xMidYMid meet’);
}
});
price history. As the charts show conflicting signals on low against high timeframe, what are we to make of this? Follow along to find out!
IS THE BITCOIN BULL RUN FADING?
CryptoQuant chart hints that #Bitcoin may be entering a bearish phase, signaling potential trouble ahead.
So much for #Uptober… pic.twitter.com/ZhVmbgsleh
— Coin Bureau (@coinbureau) October 20, 2025
Crypto Quant’s Bull-Bear Market Cycle Indicator has gone underneath the 365-day MA line without much hesitation. Now, it is good to keep in mind that this is one indicator of many. And price can still rally upward. Though the blue and red/orange-ish periods look like good periods for buying and then selling in profit. And the latest run from $70,000 to $125,000 between April and early October is not very visible on this BTC price chart.
DISCOVER: Best Meme Coin ICOs to Invest in 2025
Another piece of news on the positive side, is the Bitcoin ETP launched by Blackrock in the UK today. This will be an interesting week to watch! Let’s dive into our technical analysis and if you have not read last week’s article on Bitcoin, you can do so here.
BTC USD Price Working Hard: Will $110,000 Support Be Reclaimed?
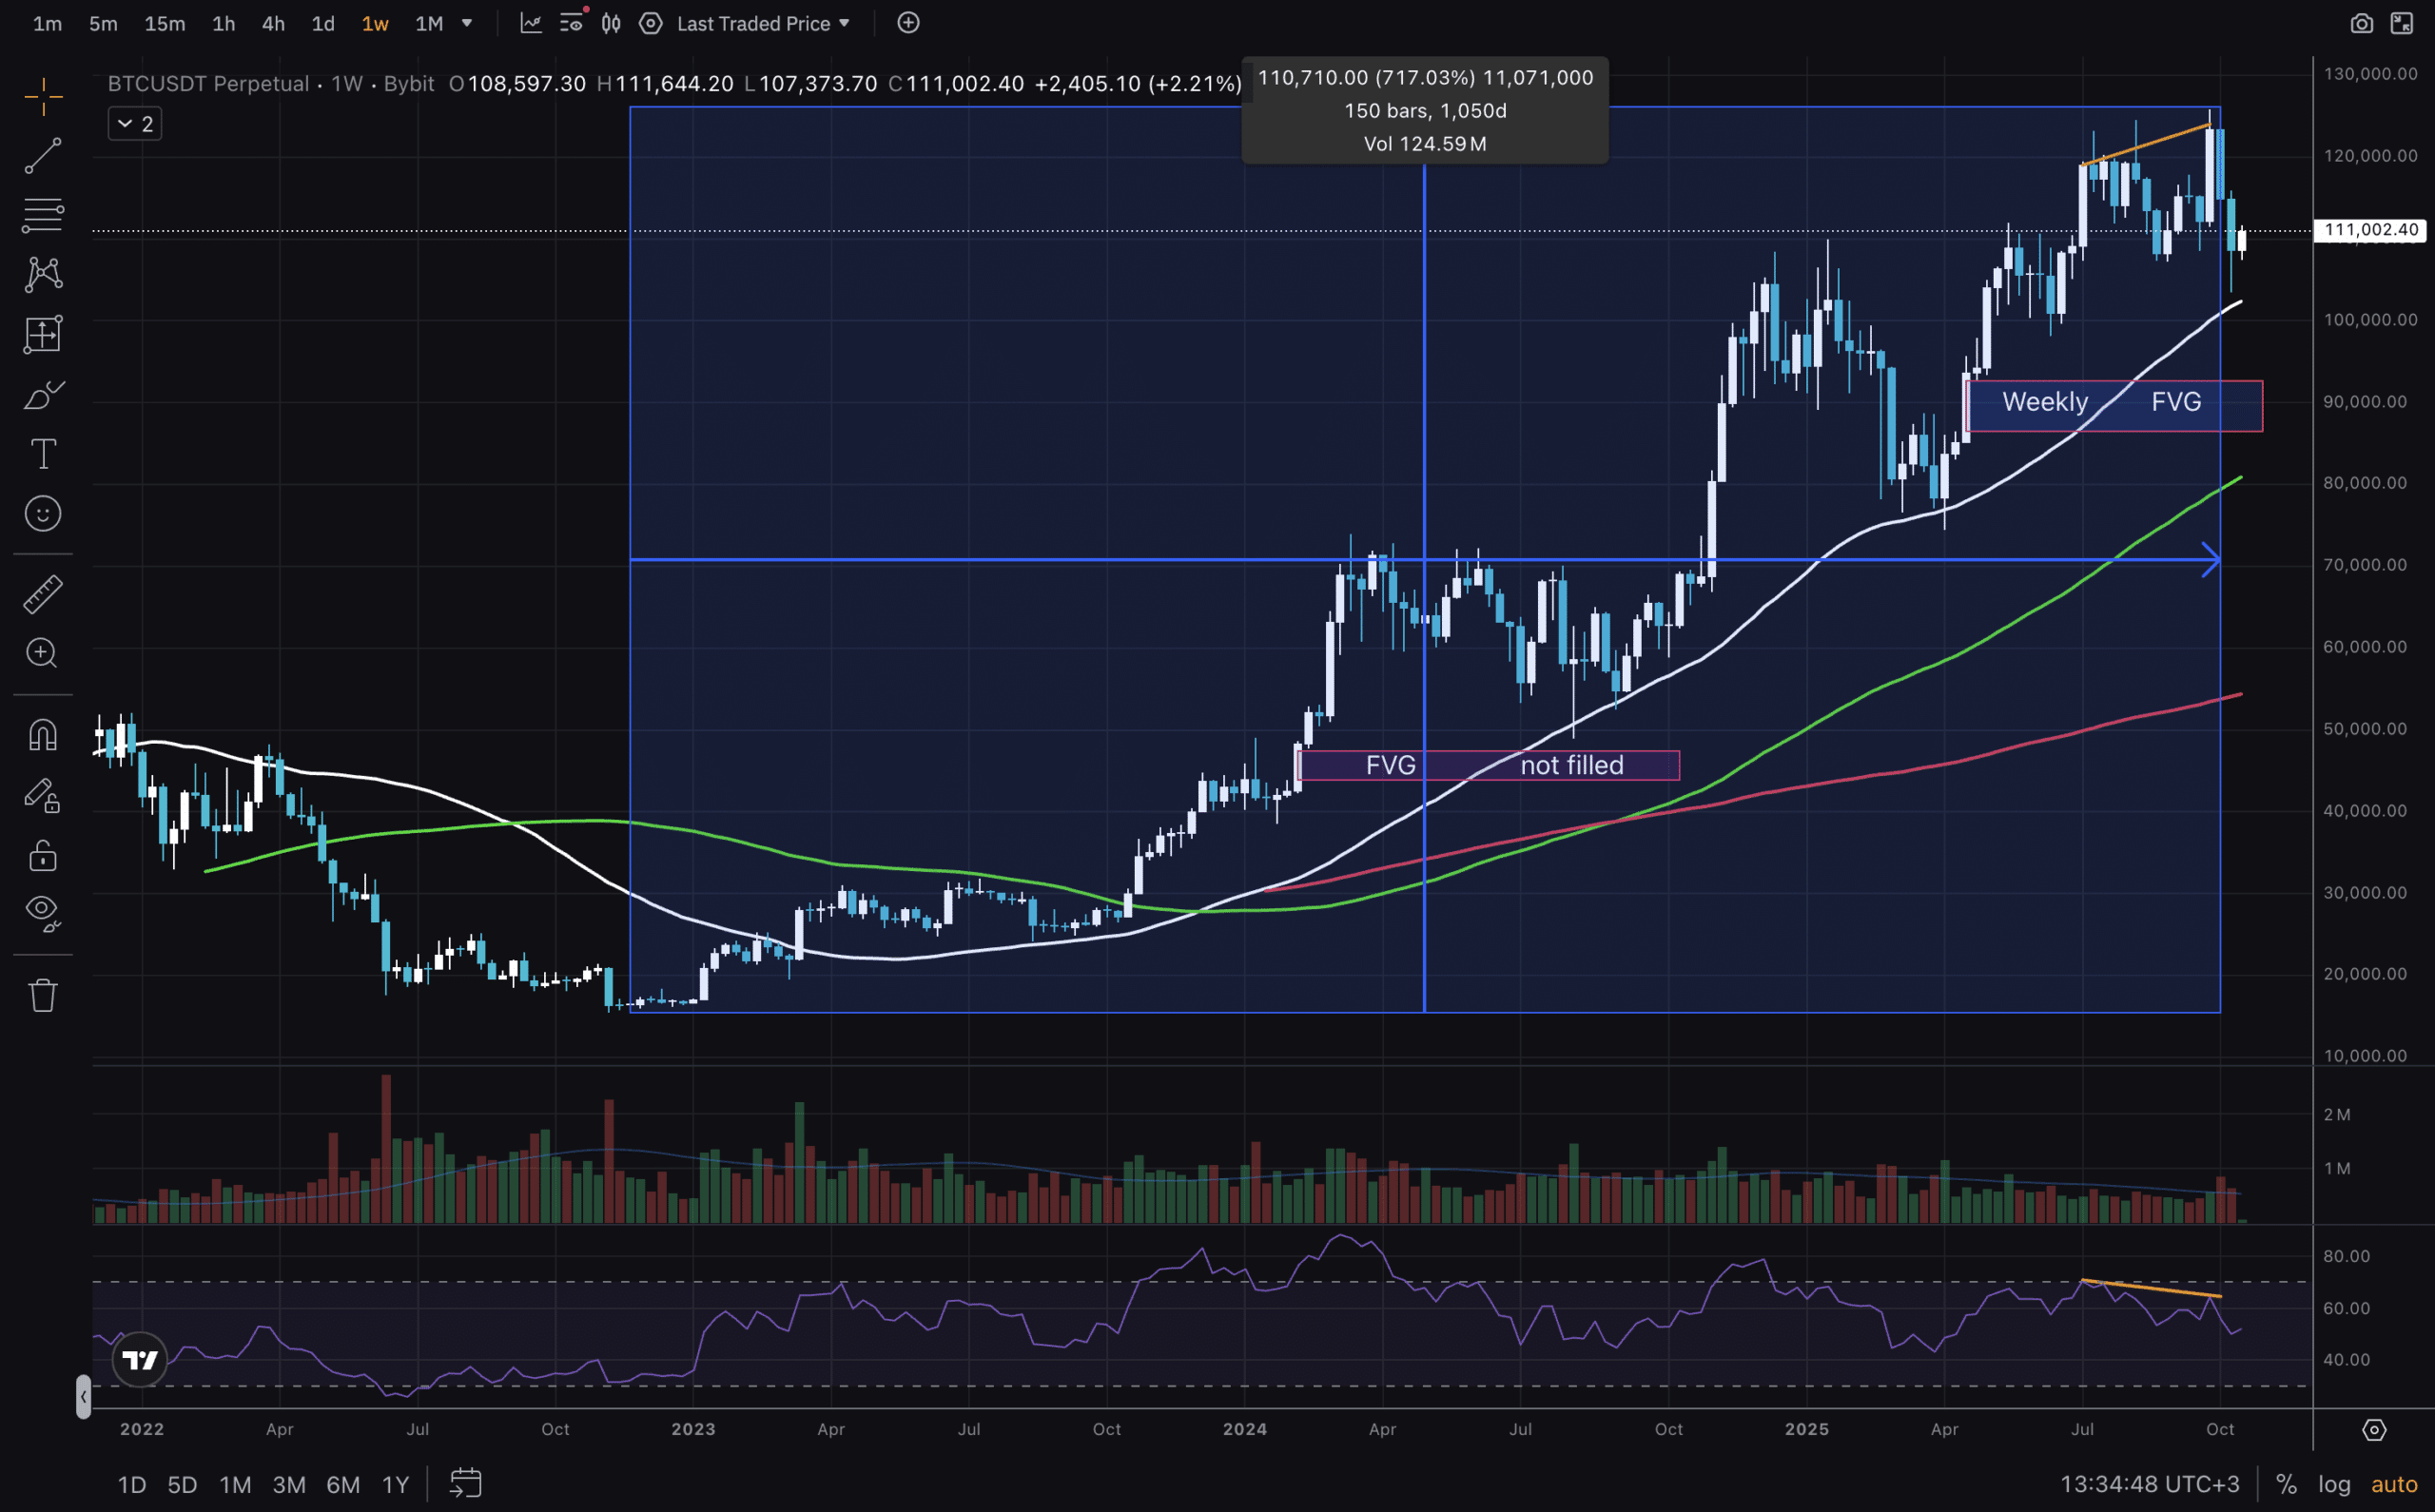
(Source – Tradingview, BTCUSD)
Starting with the Weekly timeframe, we can track how long it took Bitcoin to get from the lowest price point of $15,440 in 2022 to the highest in 2025 – $126,150 (last week). That is $110,710 of growth or 717% in 1050 days to be exact. A decent 7x if you are to ask old school conservative investors.
From the technicals, Bitcoin’s RSI is showing a divergence, indicating weakness from buyers. Moving Averages have proven yet again as strong support and showing an unbroken uptrend.
DISCOVER: Top Solana Meme Coins to Buy in 2025
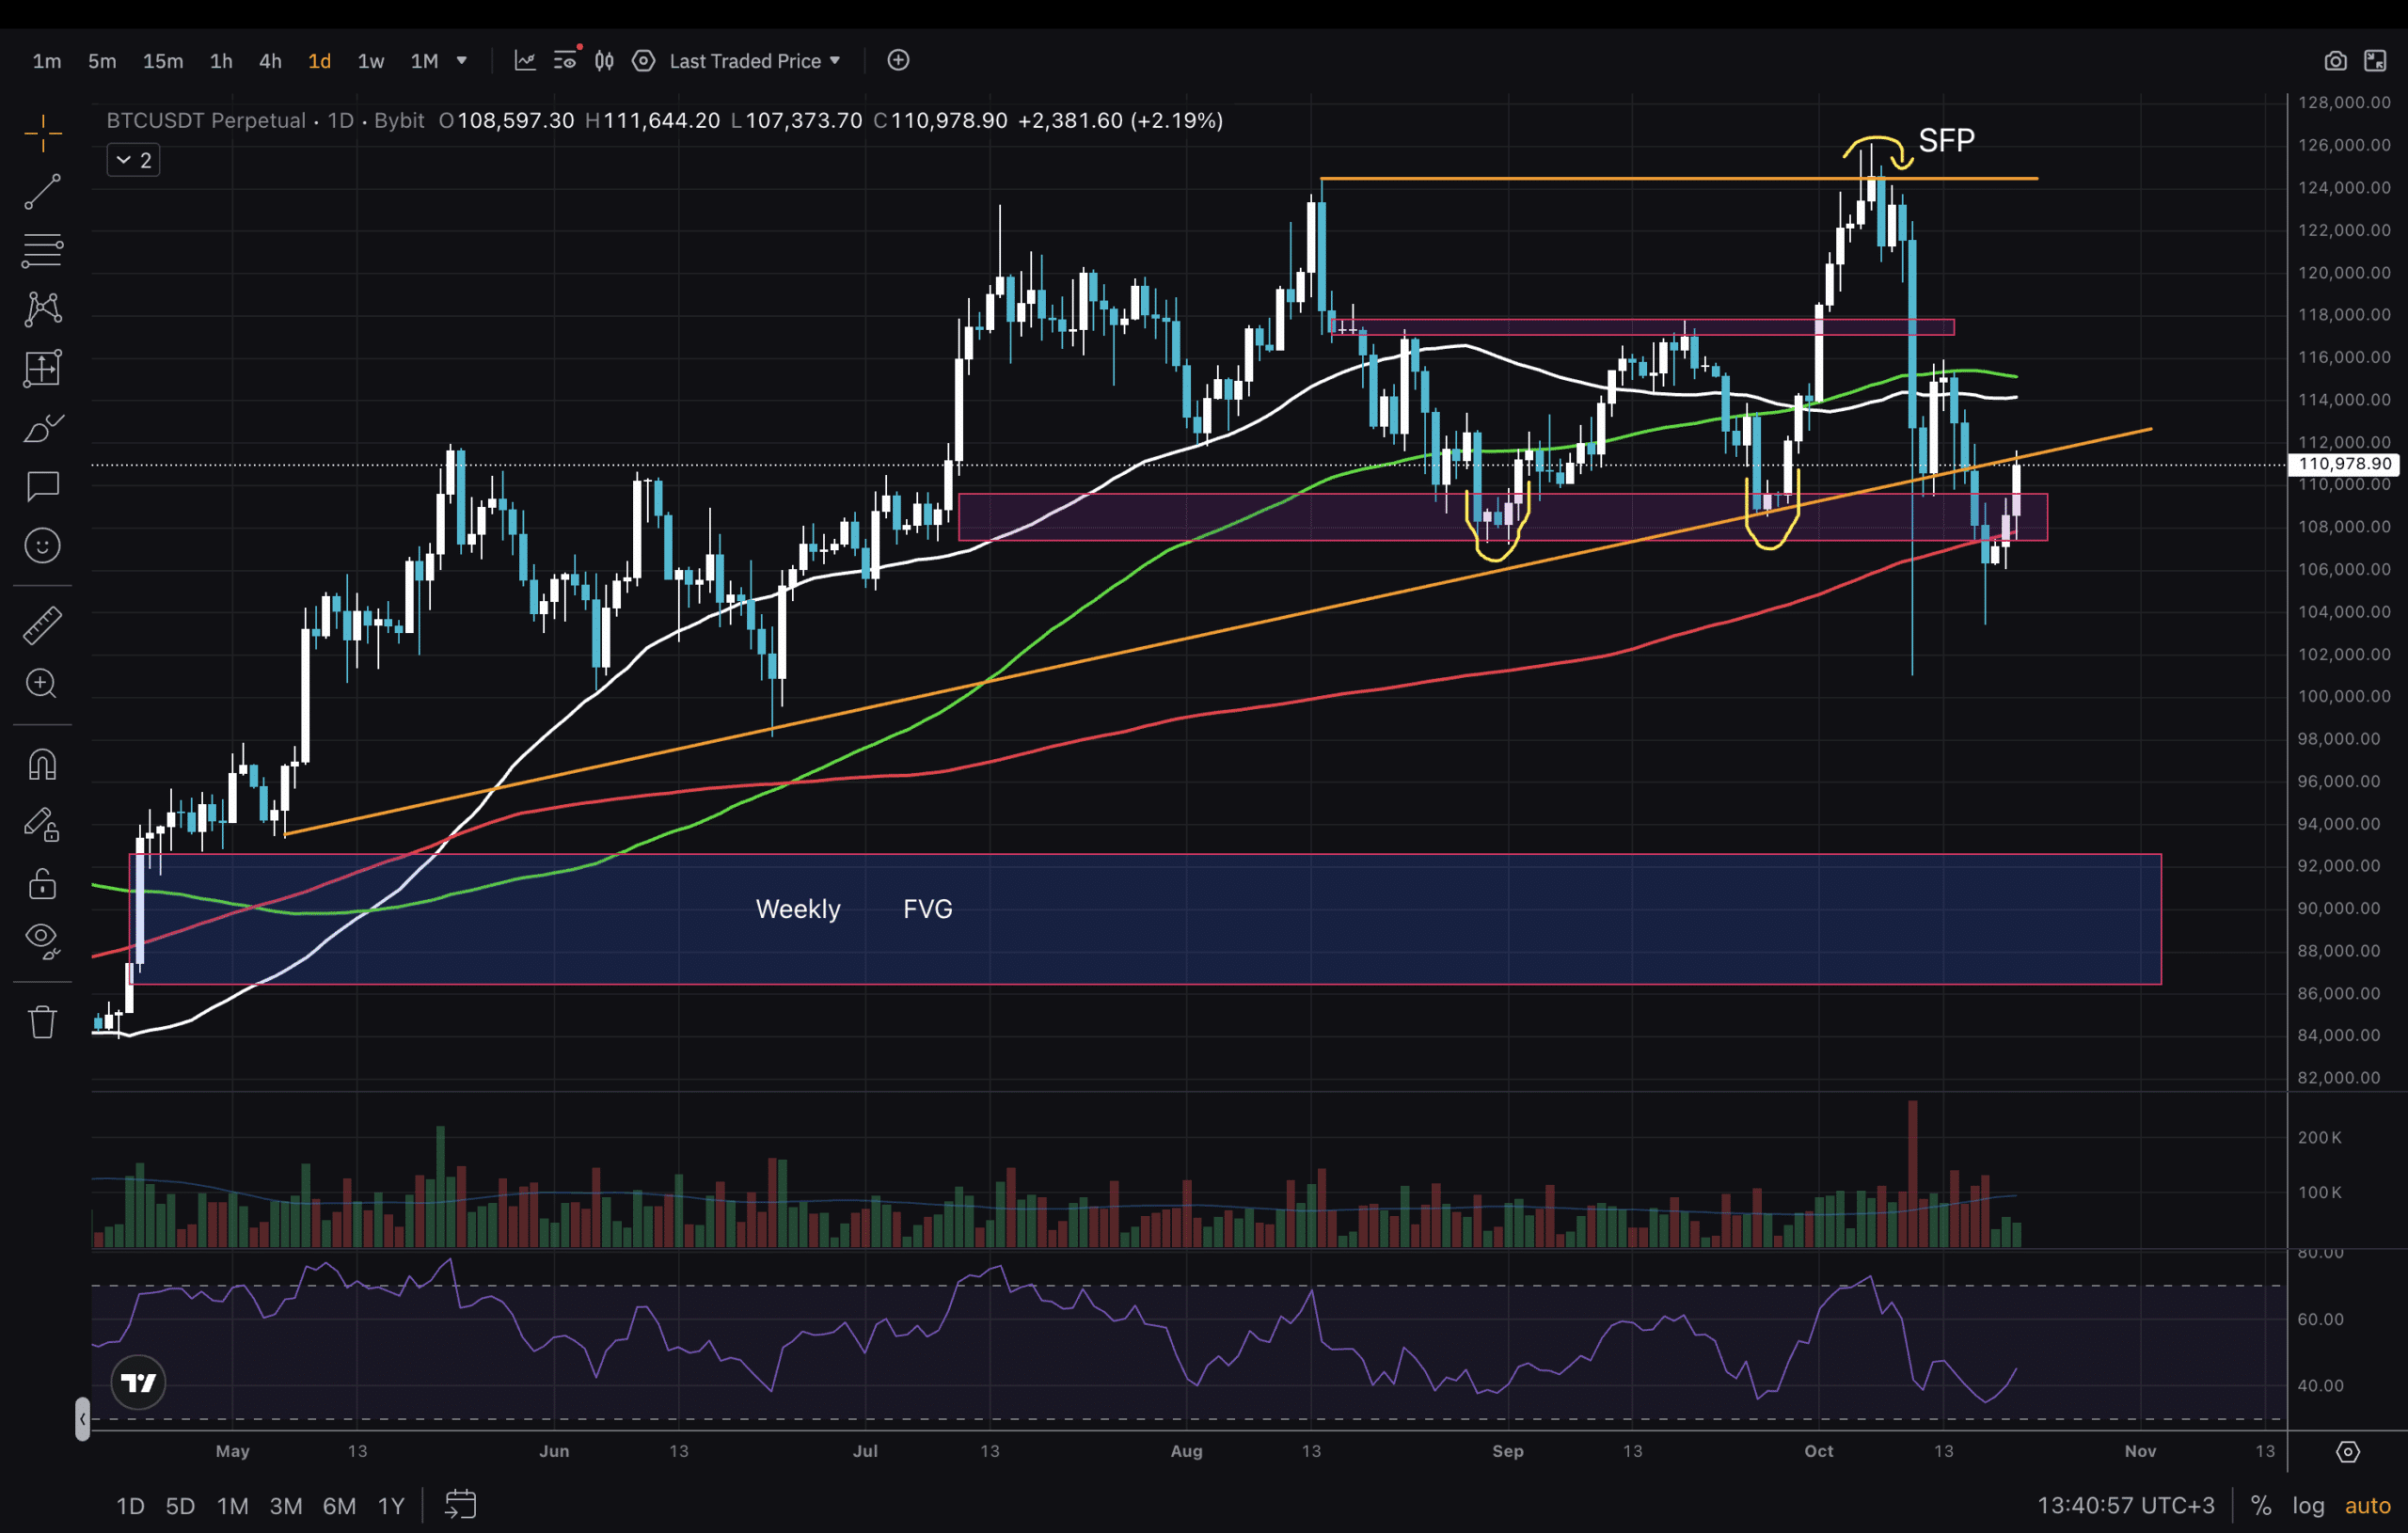
(Source – Tradingview, BTCUSD)
Next for our analysis is the Daily chart. We have the SFP preceded by a Bearish Engulfing candle and followed by a strong sell-off. This sent price underneath MA200 and led to a rejection from MA100 upon retest. The $110,000 support failed to hold and we are currently witnessing a retest of the broken uptrend support line.
Diagonal lines aren’t really great, which is why we also have the $107,000-$110,000 orderblock that held price multiple times. Will that Weekly FVG get filled? Potentially, if bulls can’t reclaim the $110,000 key level. RSI is reset, but will it run?
DISCOVER: Top 20 Crypto to Buy in 2025
Bullish Low-Timeframe Signs: Do They Matter?
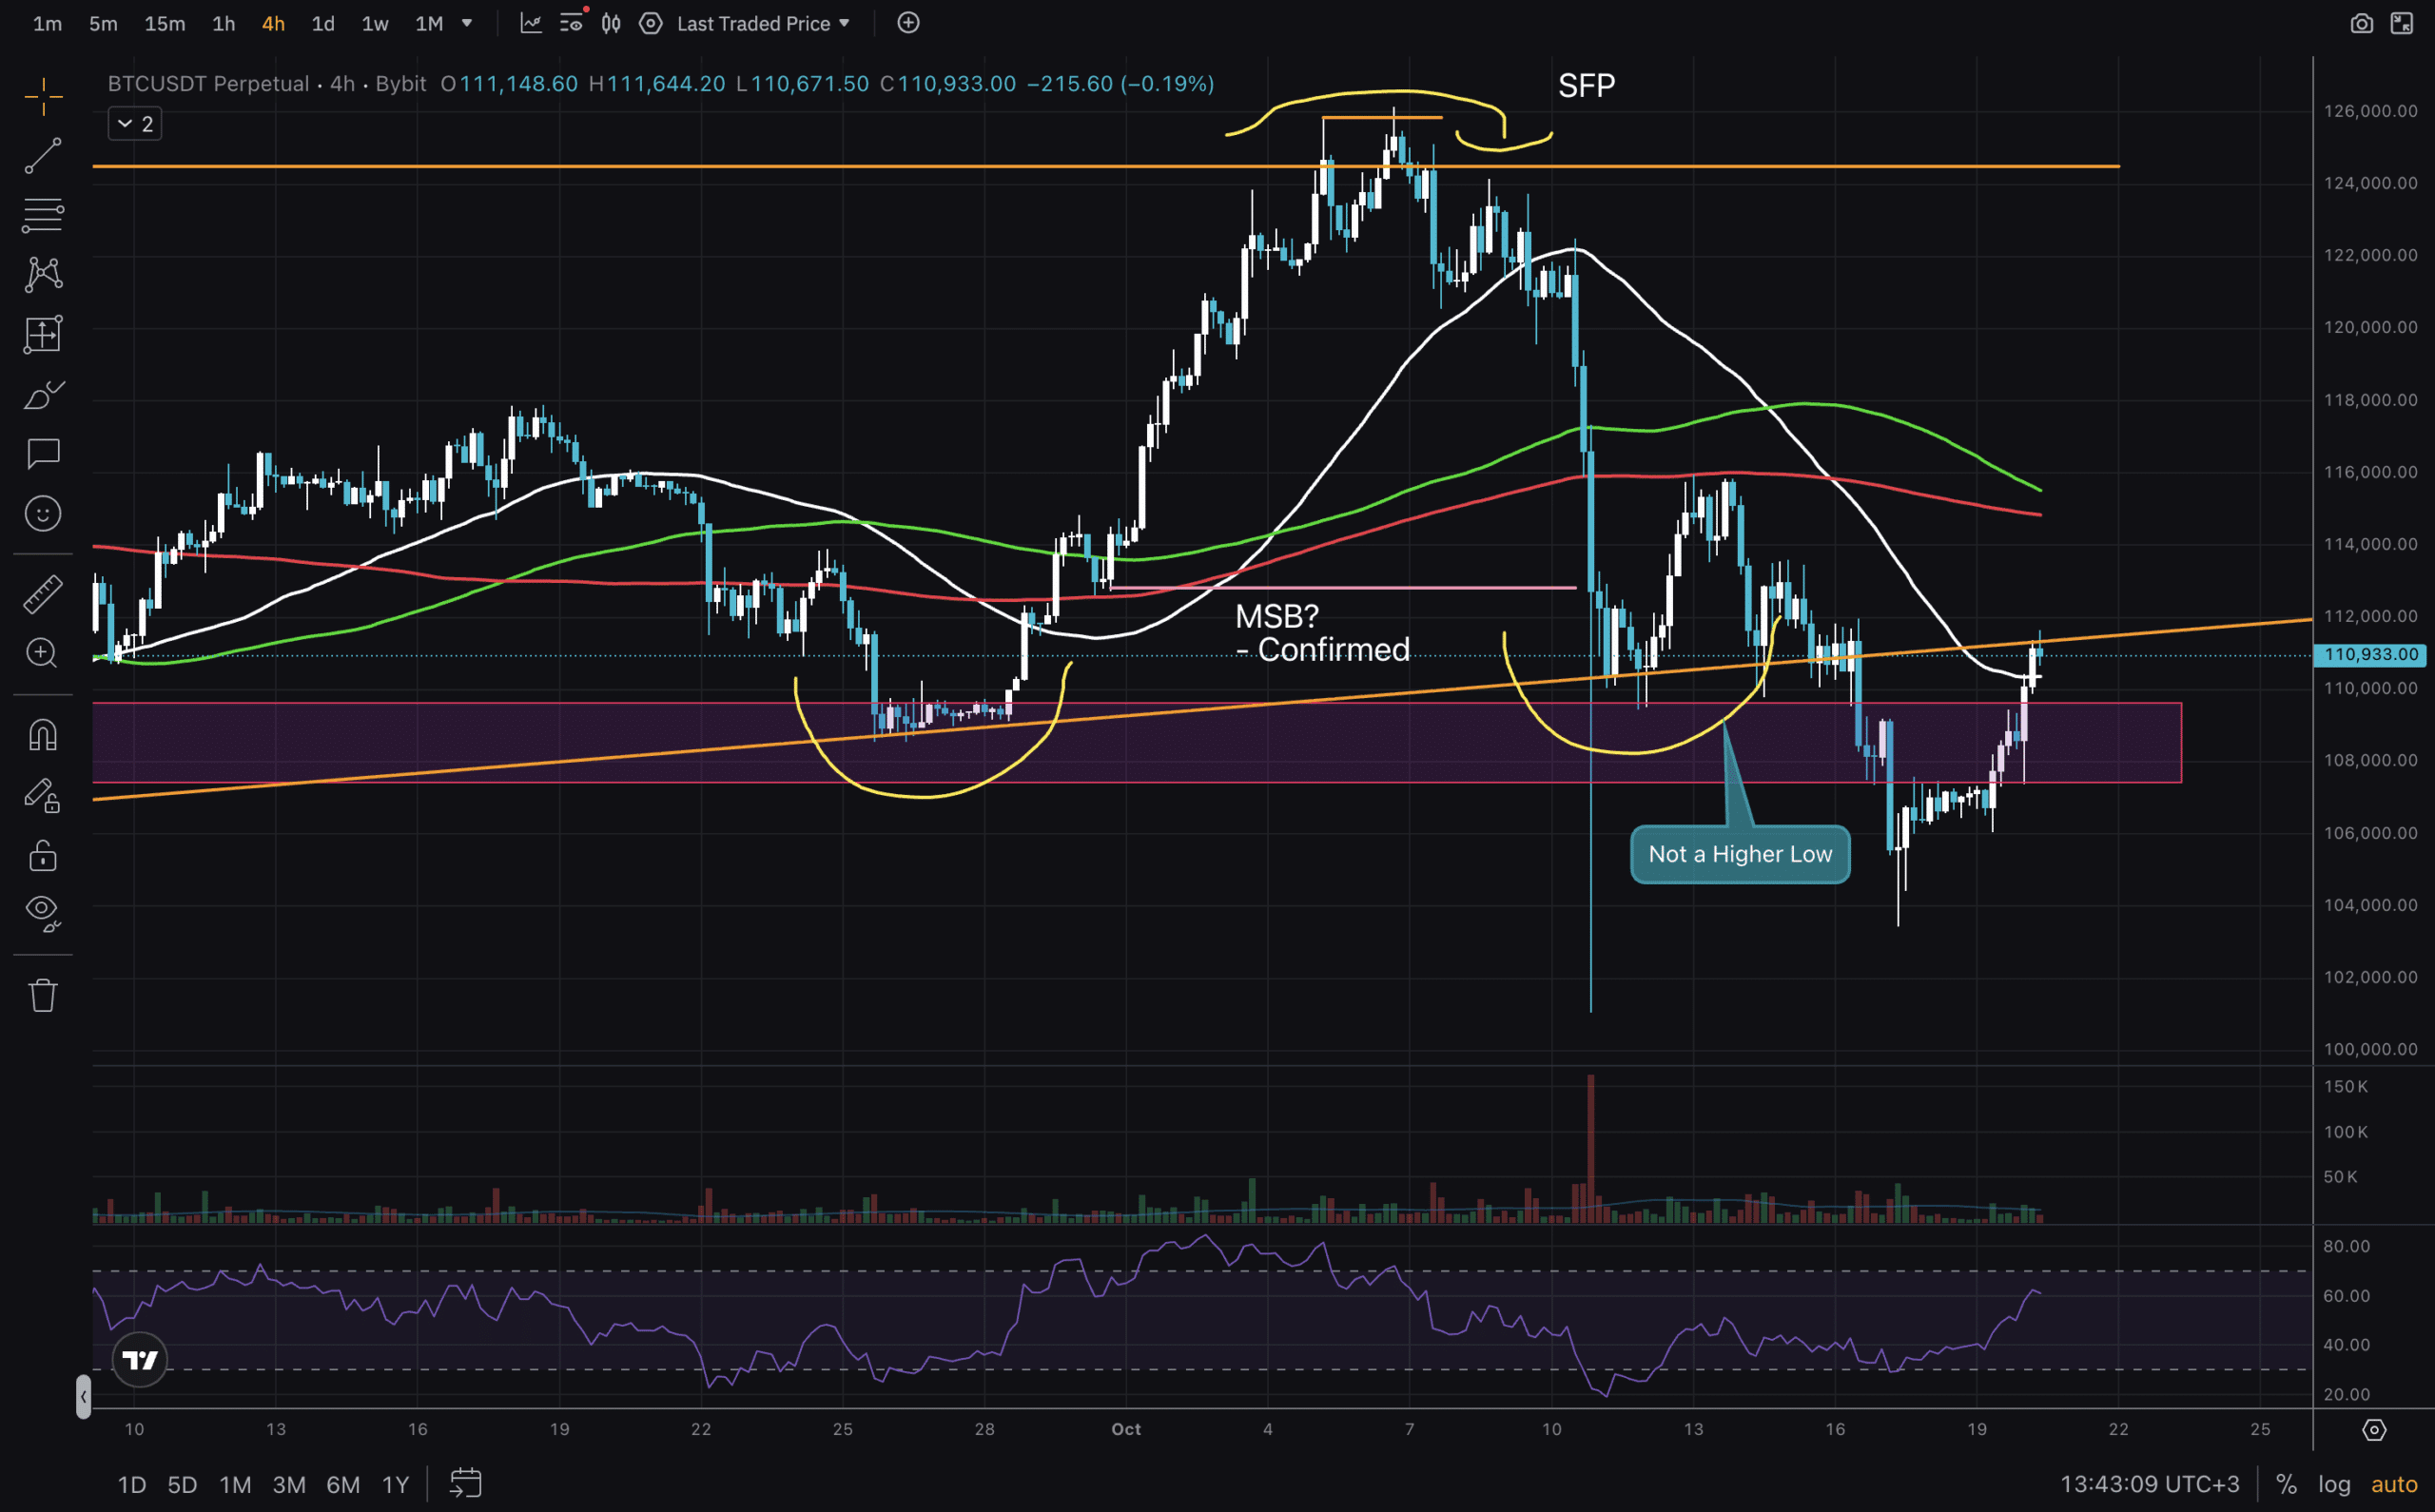
(Source – Tradingview, BTCUSD)
On this last chart from 4H timeframe, we zoom in for extra details. Have a small SFP that showed rejection from resistance, followed by a now confirmed MSB. There was a potential for a Higher Low, though MA200 was ruthless by pushing price down to $103,000.
The RSI entered the upper half of its range, though bulls want to see all MAs reclaimed and $110,000 to hold. At this point price is at resistance and could head back down to make a Lower Low. Let’s see what the week brings. Stay safe out there!
DISCOVER: Next 1000X Crypto – Here’s 10+ Crypto Tokens That Can Hit 1000x This Year
Join The 99Bitcoins News Discord Here For The Latest Market Updates
BTC USD Wants Above $110,000: Will It Reclaim Key Support?
- RSI on Weekly and Daily have space to grow now.
- 4H chart shows bearish factors, with an MSB and a retest of lost support.
- Weekly FVG at $86,000-$92,000 zone. Will it get filled?
- Key level to hold for upward continuation is $110,000.
- Bitcoin ETP launched in the UK today.
The post BTC USD Price Wants Above $110,000: Will Bitcoin Price Reclaim Key Support? appeared first on 99Bitcoins.