
The Bitcoin rainbow chart shows  BTC ▼-0.12% cruising well above $100K and even on the cheap.
Yet, 99Bitcoin’s analysis shows that USDT’s supply is peaking, and leveraged shorts are swelling, which are signs we could oscillate either way.
Meanwhile, critiques of popular predictive models like economist Raoul Pal’s M2-Bitcoin correlation make us wonder, is this cycle different? Is the alt-season cancelled?
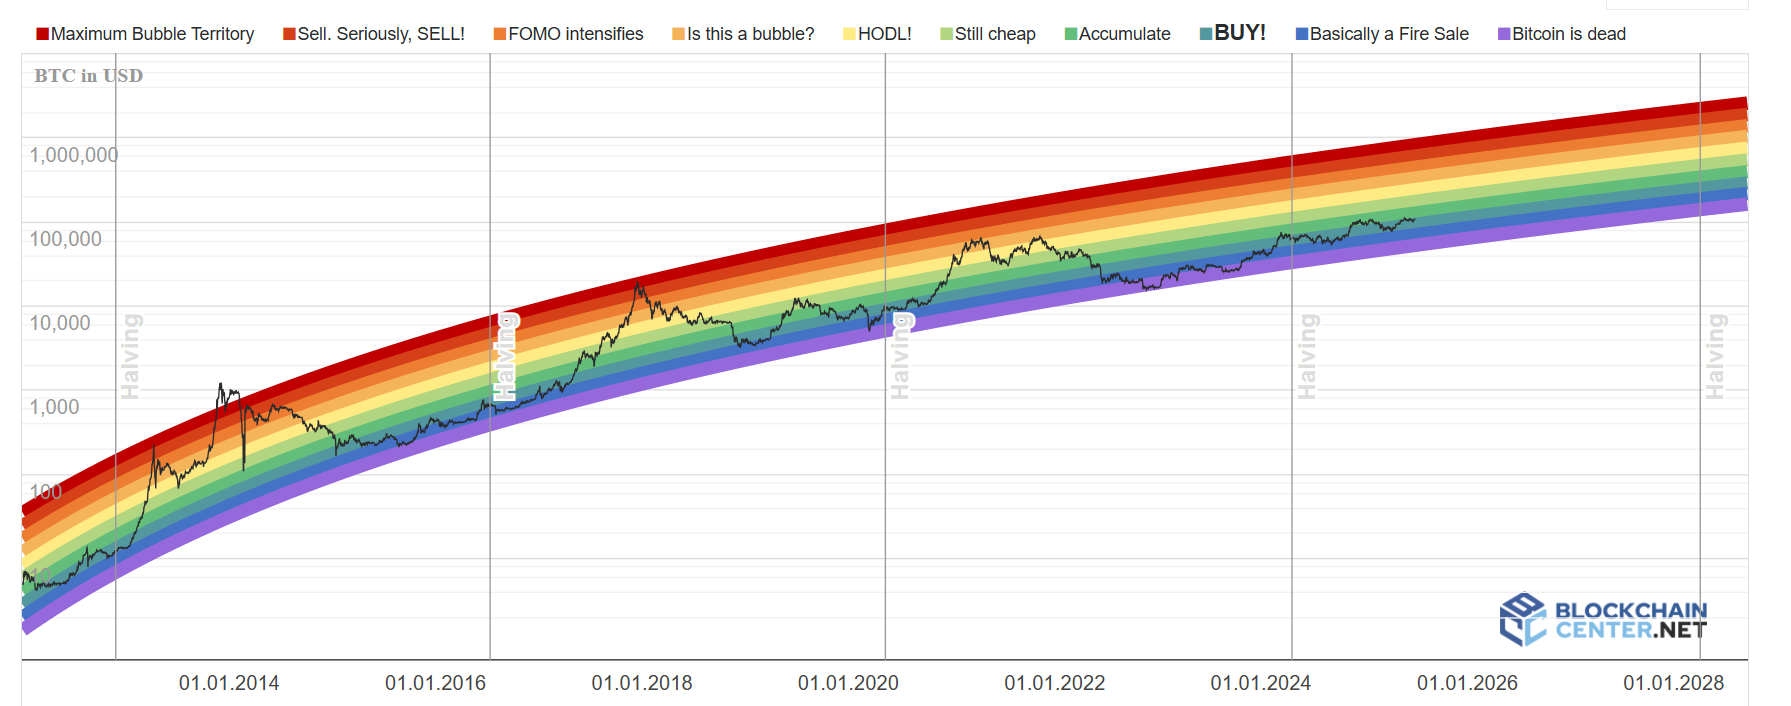
Bitcoin Rainbow Chart: The Battle Between Bulls and Bears
Bitcoin rebounded from a multi-month low of $98k, wiping out bearish positions priced on geopolitical fears. Currently trading near $108,952, BTC is consolidating within the $106k–$108k range as bulls eye a retest of the psychological $110k level.
One thing to note: well-known trader James Wynn has a 40x short position, worth $1.49 million, that hinges on $108,630 as a key liquidation level. Wynn and other bearish traders could face a short squeeze if Bitcoin breaks above this zone.
All of this could trigger a new BTC ATH and subsequent alt-season later in the summer.
Altseason loading… pic.twitter.com/sYgCmHNEv7
— Julien Bittel, CFA (@BittelJulien) June 28, 2025
Furthermore, Tether’s circulating supply hit a record $158 billion late last week. Pair this with BlackRock’s steady $1.15B weekly Bitcoin buys, which clearly signals that institutions are positioning with intent.
Critiquing the M2-Bitcoin Correlation
Bitcoin’s run past six figures has reawakened an old debate: Is any of this actually predictable? Raoul Pal says yes, pointing to M2 money supply trends as a crystal ball for BTC. However, 21st Capital Co-Founder Sina says that’s nonsense.
Epic collection of Raul Pal’s disastrous recommendations
People actually pay to listen to him
— Sina
21st Capital (@Sina_21st) January 15, 2025

In a takedown posted June 24, he argued the model’s predictive power dissolves on contact with reality. The more you tweak it, the worse it gets. “It’s not forecasting but forcing a story onto the chart,” he said.
Regardless, the next four months will show if we’re in a “traditional cycle” where Bitcoin goes bananas off of money printing, rate cuts, and geopolitical cooldown, or if Sina is right.
What’s Next for Bitcoin?
Blind faith in legacy Bitcoin models is fading. Analysts like Sina are urging a return to fundamentals: liquidity flows, wallet activity, and real-time network signals.
Pack your bags, boys (and girls), the next few weeks may decide whether BTC breaks orbit or gets dragged back into chop.
Join The 99Bitcoins News Discord Here For The Latest Market Updates
Key Takeaways
- Critiques of popular predictive models like economist Raoul Pal’s M2-Bitcoin correlation are spreading
- All eyes are on Powell next month as inflation lingers and labor metrics soften.
The post Bitcoin Rainbow Chart: The Next 4 Months For BTC Could Change Everything: Is History Repeating? appeared first on 99Bitcoins.