

U.S. markets edged lower Thursday as a sharp selloff in cryptocurrencies spilled into software and commodity names, with Bitcoin sliding 9% to around $66,000—its lowest level since October 2024.
Summary
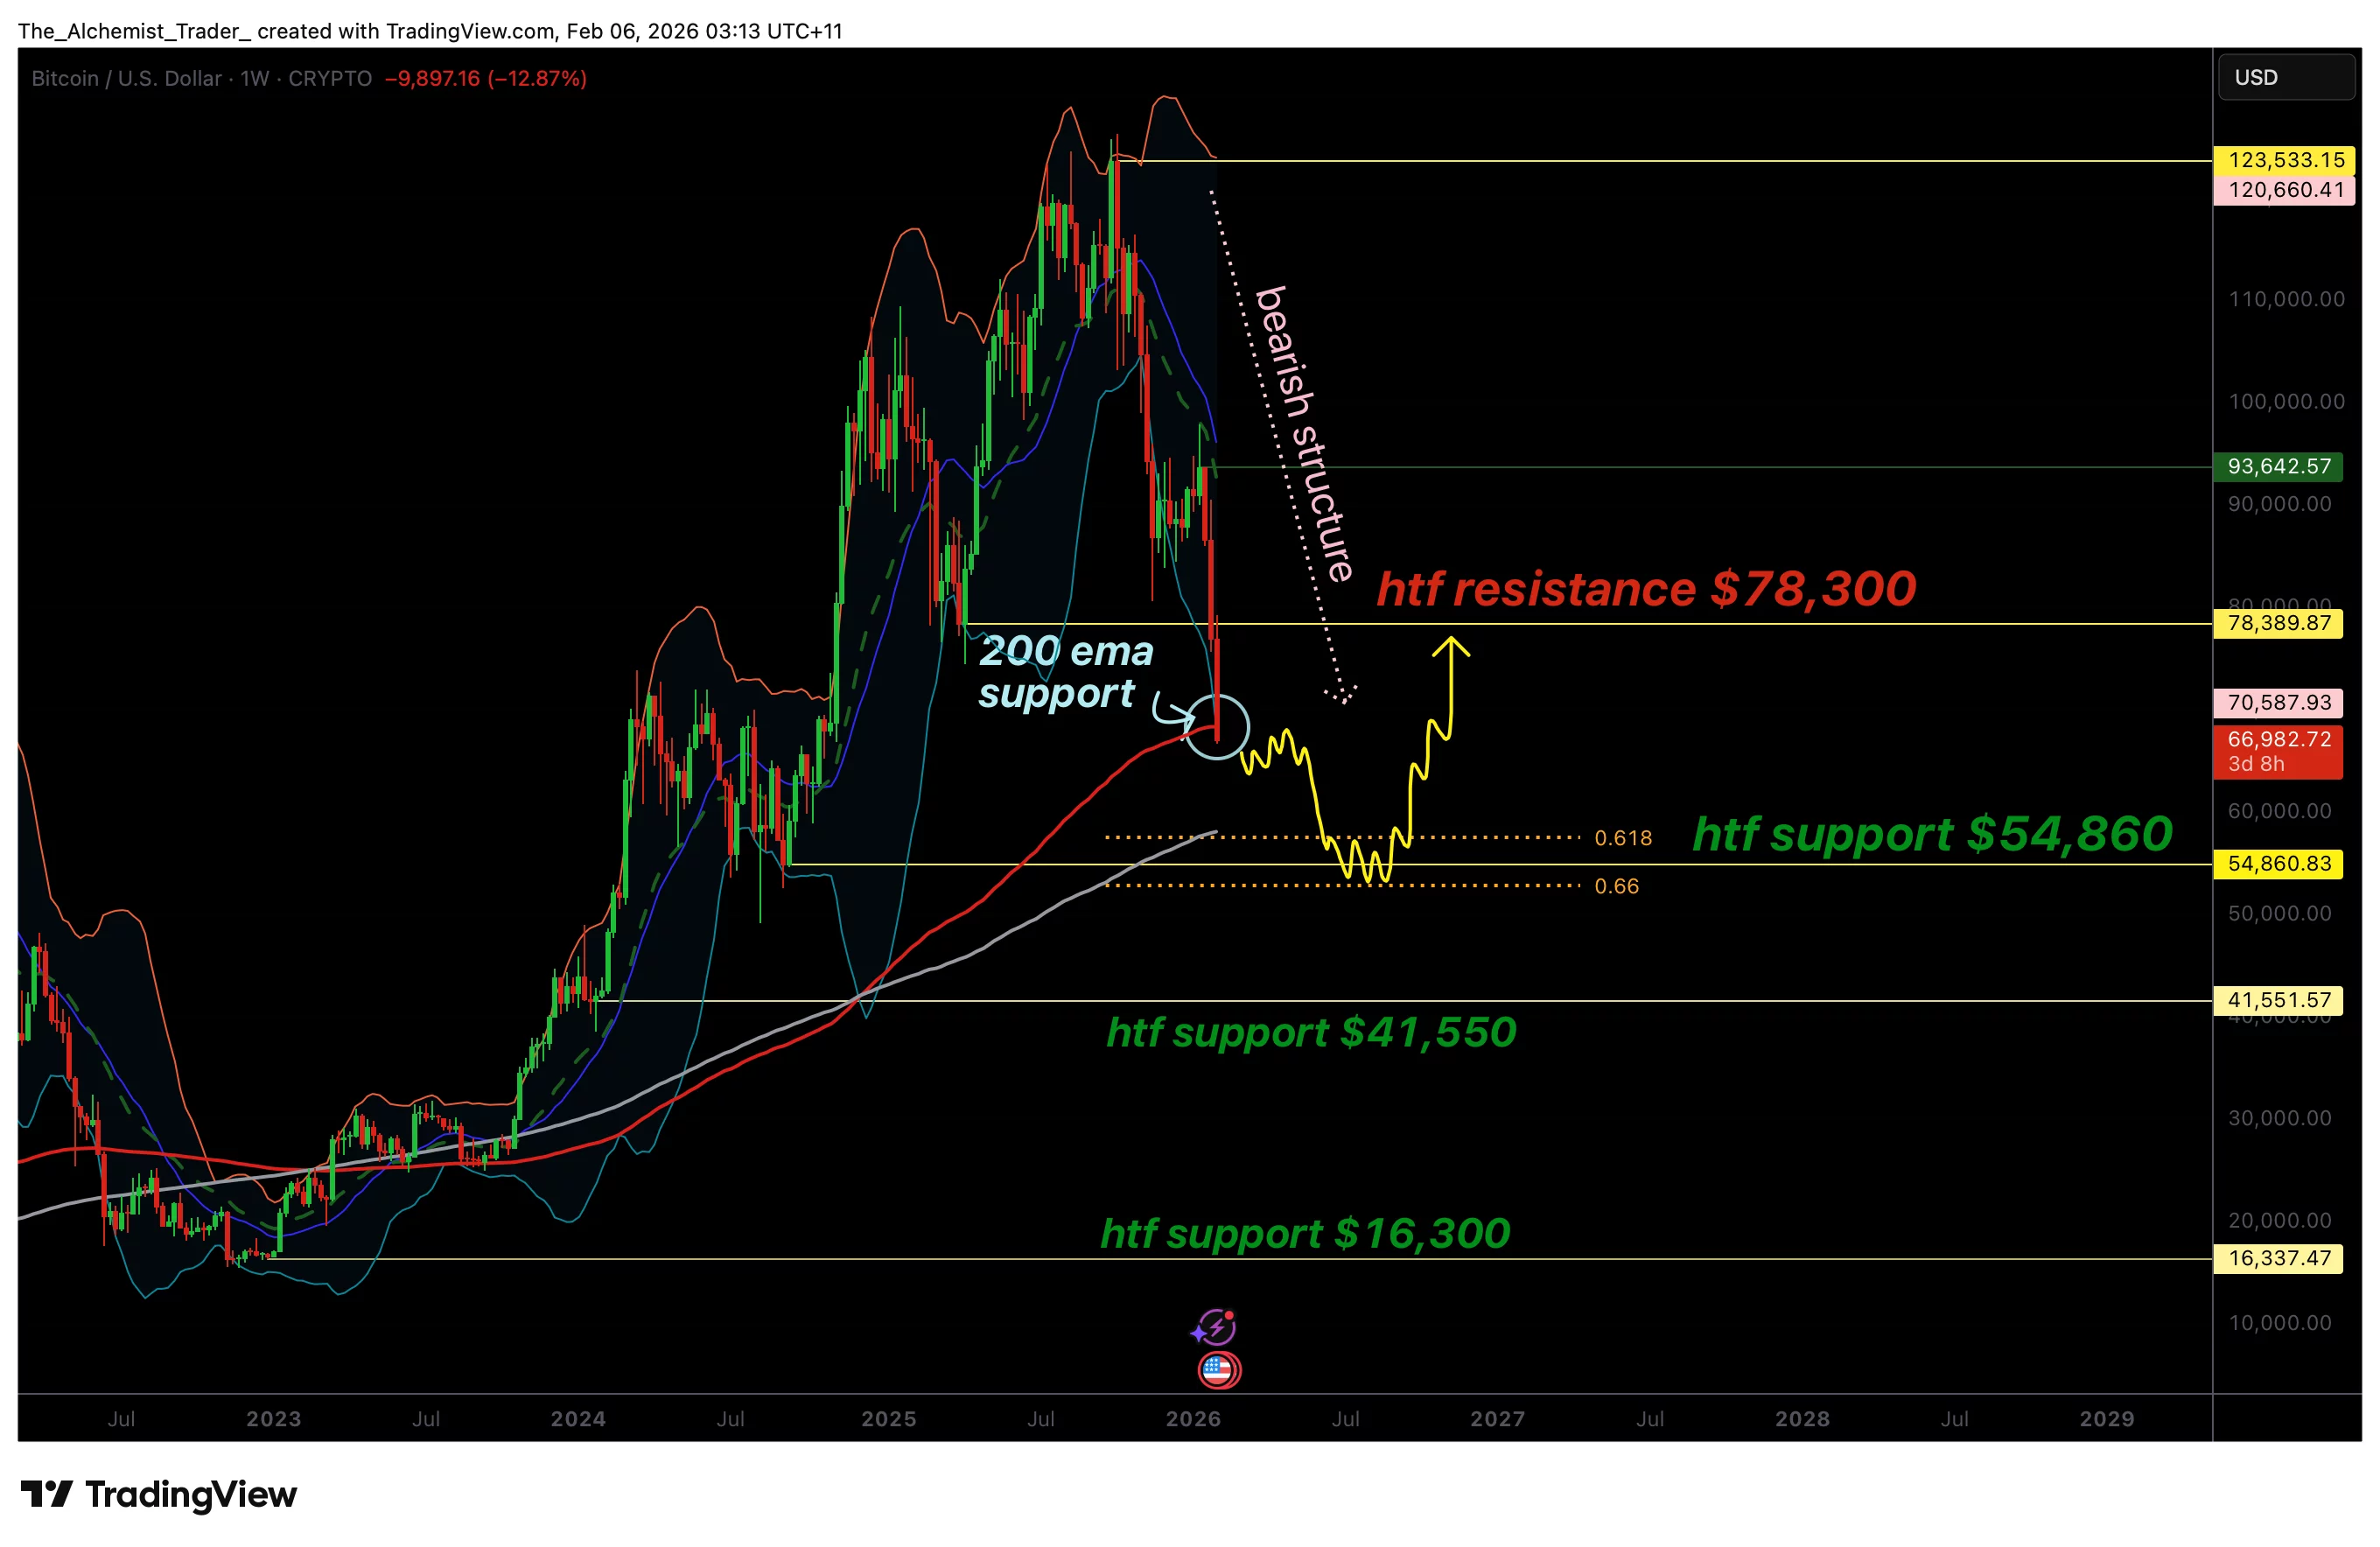
- 21-week EMA is weakening, signaling loss of bullish trend structure
- 200-week EMA is being tested, a critical long-term support level
- $60,000–$54,000 zone is key, with Fibonacci and daily support converging
Crypto-exposed stocks led decliners, with Strategy, Mara Holdings, and CleanSpark each falling about 12%, while silver plunged 13% and gold slipped 2% in a broad risk-off move.
The Nasdaq 100 headed for a third straight day of losses as investors weighed sustained selling pressure in Bitcoin (BTC), which is testing key long-term technical support and raising concerns of a deeper correction toward the $60,000 level.
Bitcoin price action has entered a clearly corrective phase over the past several weeks, with bearish momentum intensifying across higher timeframes.
After failing to sustain upside continuation, BTC has rotated lower and is now testing a critical cluster of long-term technical support levels.
Most notably, price is approaching major weekly EMA support, placing the market at an important inflection point where the next directional move is likely to be determined.
While Bitcoin has historically responded strongly to this area, current market structure suggests that downside risk remains elevated.
If key moving average support fails on a closing basis, the probability of a capitulation-style move increases, potentially dragging price below the psychological $60,000 level.
Bitcoin price key technical points
- 21-week EMA is weakening, signaling loss of bullish trend support
- 200-week EMA is being tested, acting as a last major structural defense
- $60,000–$54,000 zone holds key confluence, including Fibonacci and daily support
From a higher-timeframe perspective, Bitcoin’s structure has shifted decisively bearish. Consecutive lower highs and expanding downside candles reflect aggressive selling pressure, with buyers struggling to regain control.
The loss of the 21-week EMA has historically marked a transition from bullish continuation into deeper corrective phases, and current price behavior aligns with that pattern.
Bitcoin is now trading near the 200-week EMA, a level that has only been tested during periods of extreme market stress.
The last meaningful interaction with this EMA occurred around the $27,000 region, highlighting the importance of this support in the broader market cycle. A sustained loss of this level would signal that bearish momentum remains dominant and that the market is seeking lower value.
$60,000 Support Faces Increasing Pressure
As price continues to weaken, the $60,000 level has emerged as a critical psychological and technical threshold.
A breakdown below this area would likely accelerate downside momentum, particularly if it coincides with confirmed EMA losses on the weekly timeframe.
Below $60,000, attention turns toward the $57,000 region, followed by a deeper confluence zone near $54,000. This area aligns with the 0.618 Fibonacci retracement of the broader move, as well as a key daily support region. Together, these levels form a high-probability downside target should current EMA support fail.
Aggressive bearish structure raises capitulation risk
One of the most notable characteristics of the current market is the strength and persistence of bearish momentum.
Unlike shallow pullbacks seen during strong uptrends, this correction has unfolded with speed and conviction, suggesting forced selling rather than healthy consolidation.
Historically, aggressive bearish structures often resolve with capitulation once major support levels are lost.
In Bitcoin’s case, a weekly close below the 200-week EMA could trigger panic-driven selling, flushing remaining weak hands from the market. While such moves are typically violent, they also tend to precede meaningful local bottoms.
What to expect in the coming price action
From a technical, price-action, and market-structure perspective, Bitcoin is at a pivotal moment. The current EMA support zone represents a critical line in the sand for bulls. Holding above this region could allow for stabilization and a corrective bounce, though any recovery would remain vulnerable unless key resistance levels are reclaimed.
Conversely, failure to hold weekly EMA support would significantly increase the probability of a capitulation move toward the $60,000–$54,000 region. Traders should closely monitor weekly closes and volume behavior for confirmation. Until bullish structure returns, downside risk remains elevated, and volatility is likely to persist.