

Key Takeaways
- Bitcoin’s price remains 33.2% below its October 2025 all-time high of $126,080.
- Bitcoin’s daily moving averages retain a strong bullish rating, with 13 positive readings.
- A break below $83,000 puts bitcoin’s $80,000-$81,144 support cluster in play.
Bitcoin Price Analysis: Sept. 26, 2026
Bitcoin’s price traded near $84,165 on Saturday morning, navigating a relatively narrow 24-hour range between $83,230 and $84,662 as buyers and sellers continued their tug-of-war following the rejection at $87,374. Despite the short-term hesitation, bitcoin remains 3.64% higher over seven days and 8.85% higher over two weeks, suggesting the broader recovery has not yet run out of steam.
With a market capitalization of approximately $1.69 trillion and daily trading volume of $27.86 billion this weekend, attention now turns to whether support around $83,000 can withstand another test or whether bulls can reclaim the $85,500 to $86,000 resistance region.
1-Hour Chart
The 1-hour chart illustrates bitcoin’s price transition from an aggressive advance into a period of consolidation, following its climb from $77,353 around Sept. 19 to $87,374 on Sept. 22. Since then, price action has compressed into a narrowing trading band between approximately $83,500 and $85,000, accompanied by declining volume and smaller candle bodies.
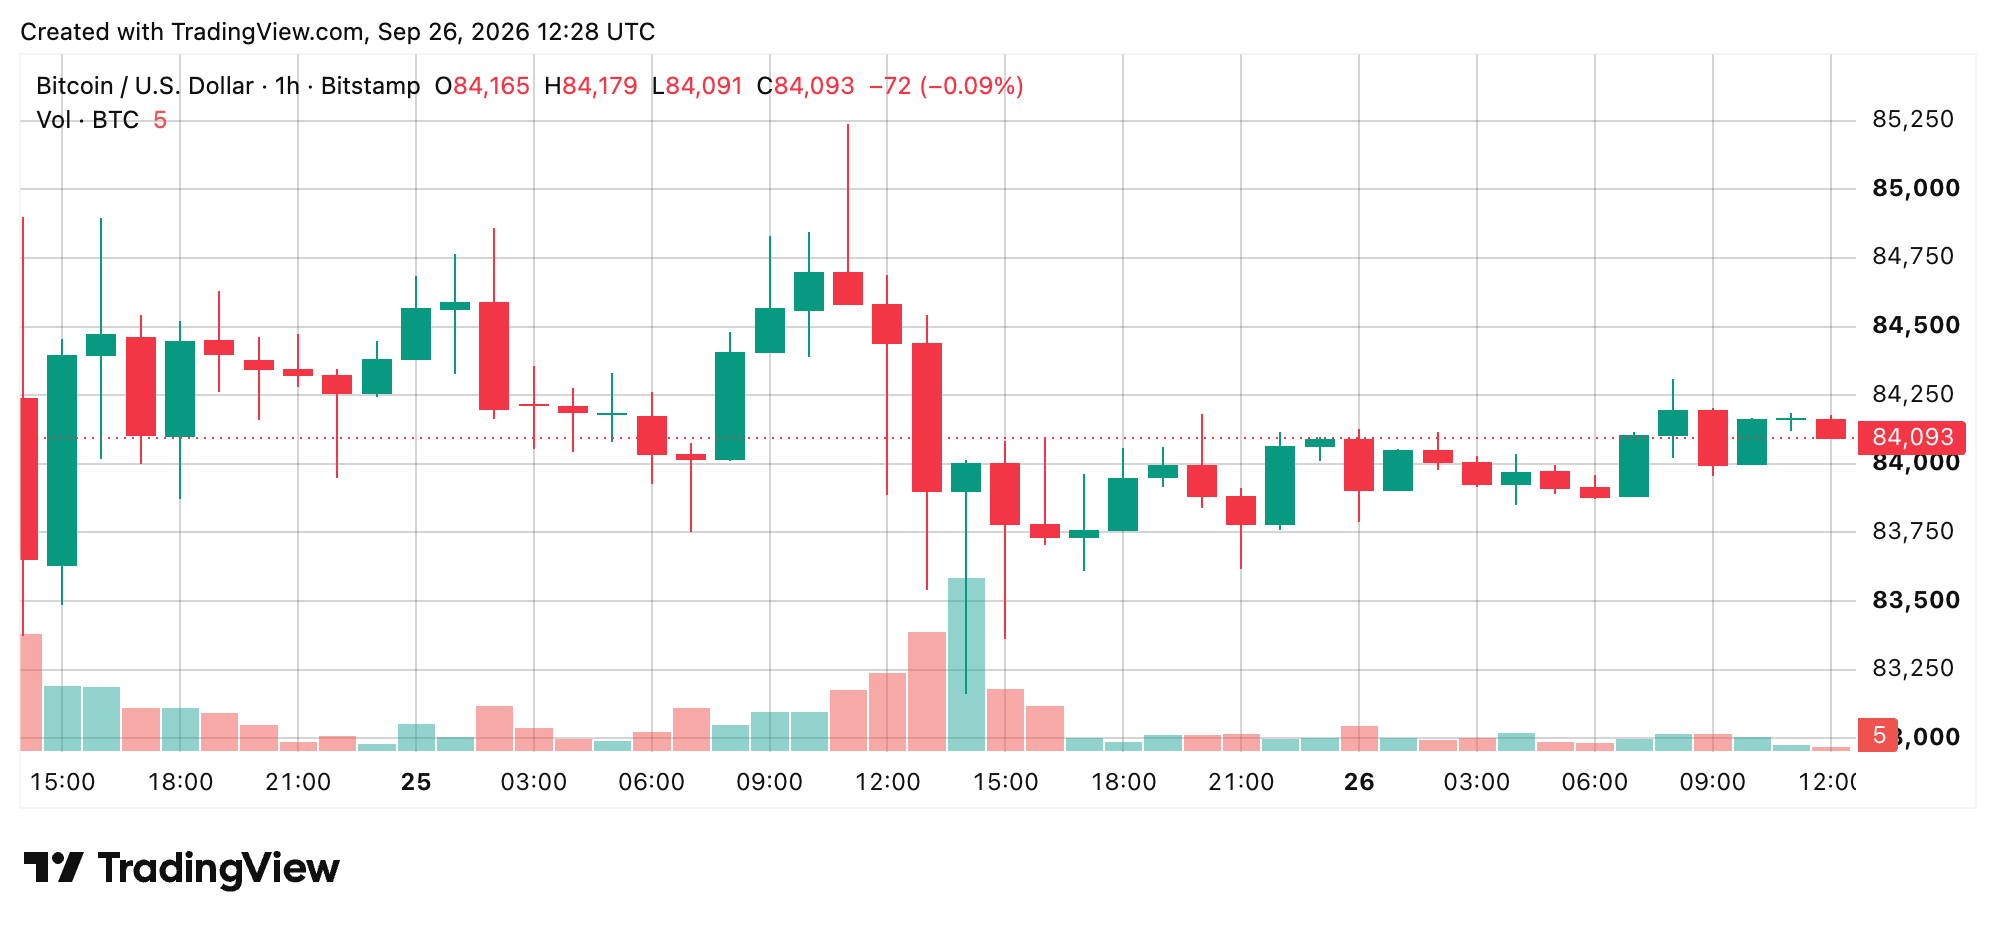
The immediate mean-reversion range sits between $83,200 and $85,200, with $84,000 serving as an important intraday reference. A sustained hold above that level, supported by expanding volume, would strengthen the continuation case, while a completed hourly candle below $83,000 followed by sustained trading beneath it would indicate that the correction from $87,374 remains unfinished.
4-Hour Chart
The 4-hour chart reveals a market digesting its September advance after breaking out of an earlier trading range between approximately $75,000 and $83,000. Following a low of $74,913 and a subsequent rally to $87,374, bitcoin’s price range has retreated into a tighter consolidation zone around $83,500 to $85,000.
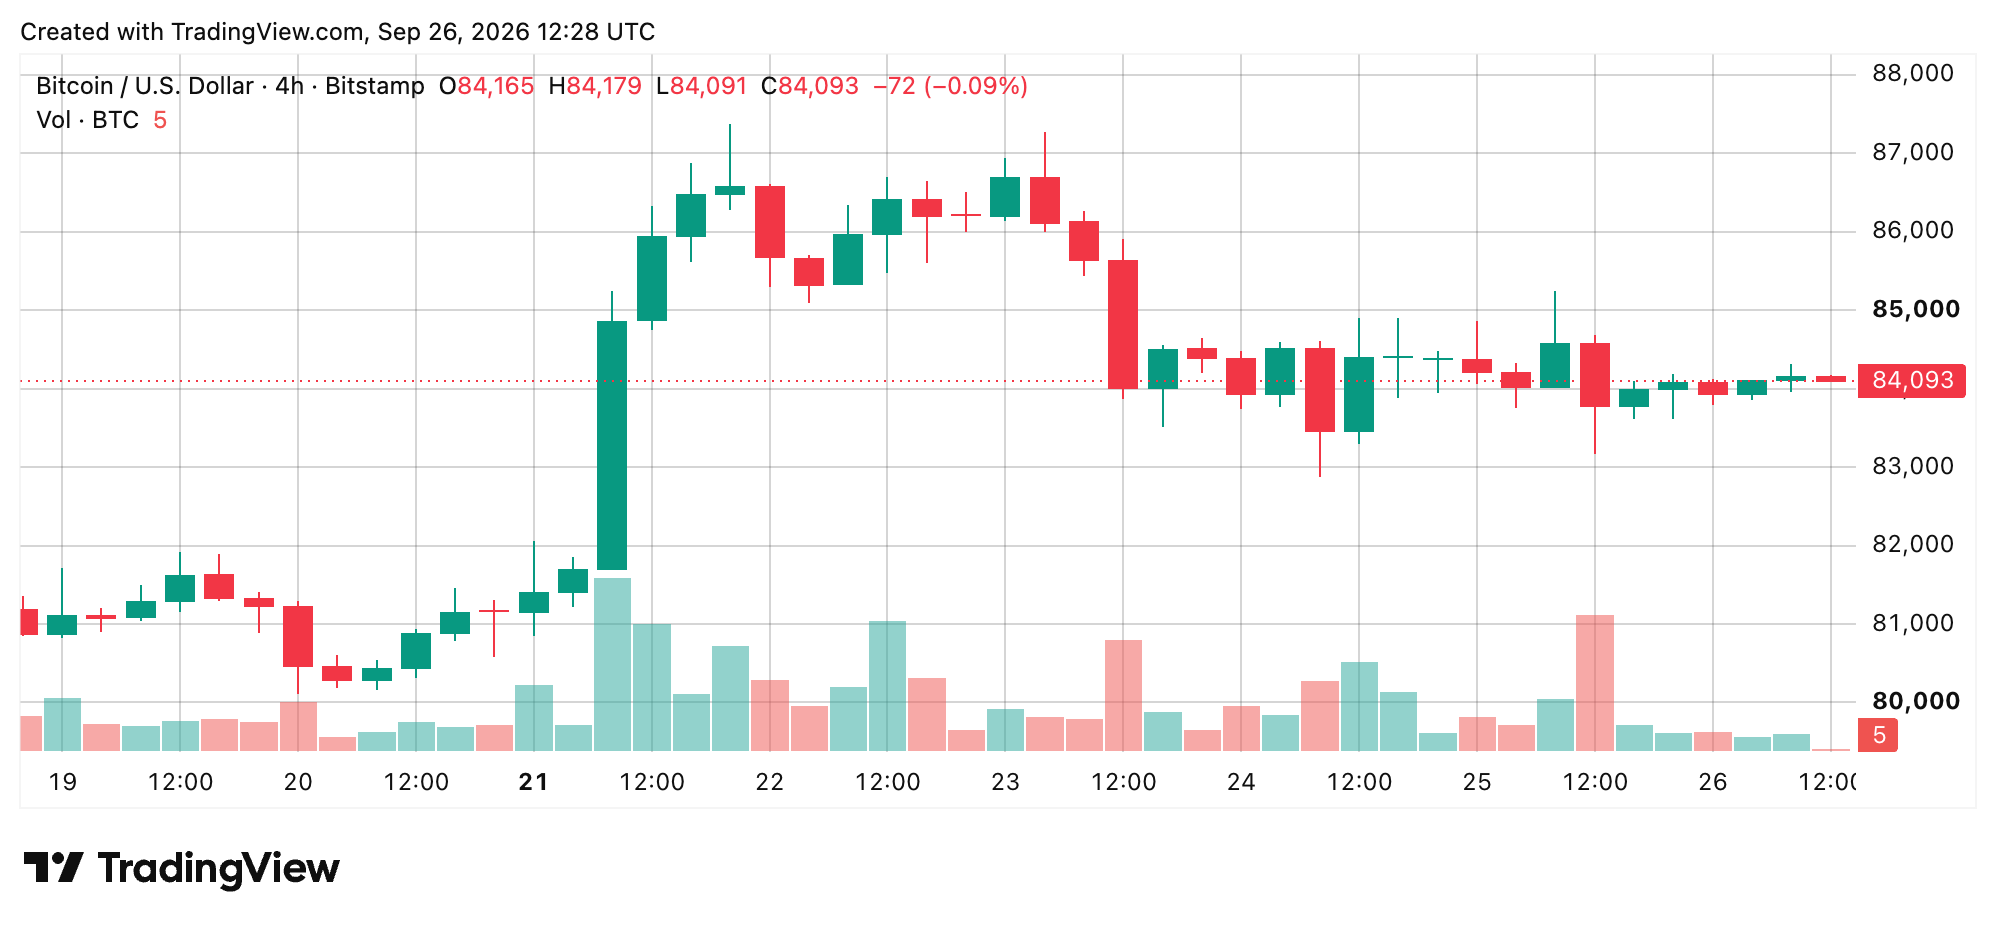
Trading volume peaked during the mid-September advance before contracting, while recent candles have developed smaller bodies around $84,165. Support remains concentrated between $83,000 and $83,500, with a sustained breakdown potentially exposing the $80,000 to $81,000 region. Conversely, a completed 4-hour close above $85,500 to $86,000, particularly with improving volume, would strengthen the case for another attempt at $87,374.
Daily Chart
The daily chart maintains a constructive longer-term structure following bitcoin’s recovery from its June low of $57,735, with the subsequent advance culminating at $87,374 in September. Although the latest pullback has interrupted upward momentum, price remains comfortably above its principal exponential and simple moving averages, preserving the broader recovery.
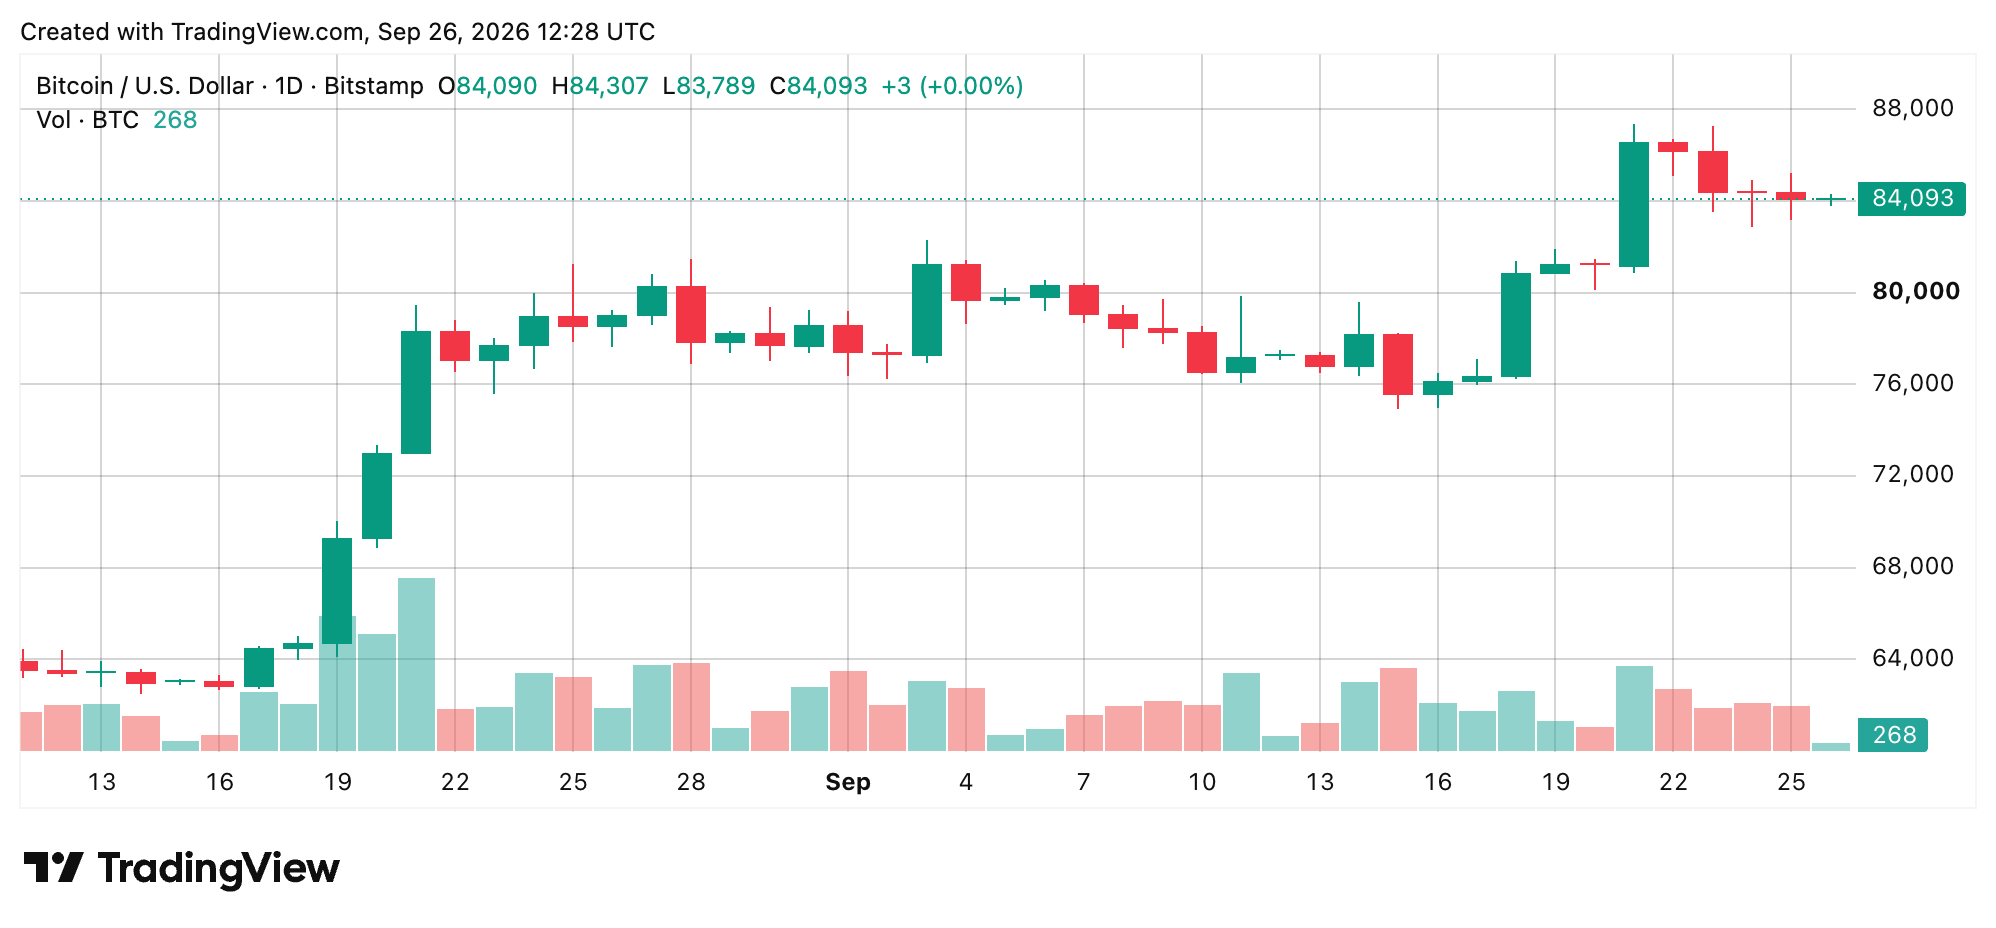
The $80,000 to $81,000 BTC price range represents an important support cluster, reinforced by several daily technical indicators, while $85,945 marks the classic first resistance pivot ahead of $87,374. Recent daily trading volume has moderated compared with the June sell-off and September advance, suggesting the market is consolidating rather than demonstrating renewed directional conviction. A sustained recovery through overhead resistance would strengthen the existing trend, whereas losing the established support cluster would weaken the daily structure.
Oscillators
The daily chart’s oscillator tape presents a predominantly neutral picture, with nine neutral readings, one positive and one negative. The relative strength index (RSI) registers 64, Stochastic stands at 75 this weekend, and the commodity channel index (CCI) reads 89, all classified as neutral. The average directional index (ADX) sits at 44, while the Awesome oscillator (AO) records 5,114, also impartial.
Meanwhile, momentum registers 8,026 but carries a negative signal, contrasting with the moving average convergence divergence (MACD) level of 2,452, which produces the sole positive oscillator reading. The Stochastic RSI fast stands at 65, Williams percent range at minus 26, bull bear power at 3,475, and the Ultimate oscillator (UO) at 62, completing a technical picture in which directional momentum remains mixed despite the broader recovery.
Moving Averages
This weekend, the 24-hour timeframe’s moving averages (MAs) offer a considerably more positive assessment, with 13 positive readings, one neutral and one negative. Bitcoin trades above its 10-period exponential moving average (EMA) and simple moving average (SMA), both at $82,943, alongside the 20-period EMA at $81,049 and 20-period SMA at $80,148. The 30-period EMA and SMA stand at $79,429 and $79,704, respectively, while the 50-period averages register $76,729 and $75,708.
Longer-term support is reinforced by the 100-period EMA at $73,480, 100-period SMA at $69,490, 200-period EMA at $74,031 and 200-period SMA at $71,002. The Ichimoku baseline remains neutral at $81,144, while the 20-period volume-weighted moving average (VWMA) is positive at $80,170. The exception is the nine-period Hull moving average (HMA), which registers a negative signal at $84,784, leaving the overall daily moving average assessment near the bullish range.
Bull Verdict:
A sustained recovery above $85,500 to $86,000, accompanied by expanding volume, would strengthen the continuation case and place the September high of $87,374 back in focus.
Bear Verdict:
A confirmed breakdown below $83,000 would weaken the current consolidation structure, potentially exposing the $80,000 to $81,144 daily support cluster.
