

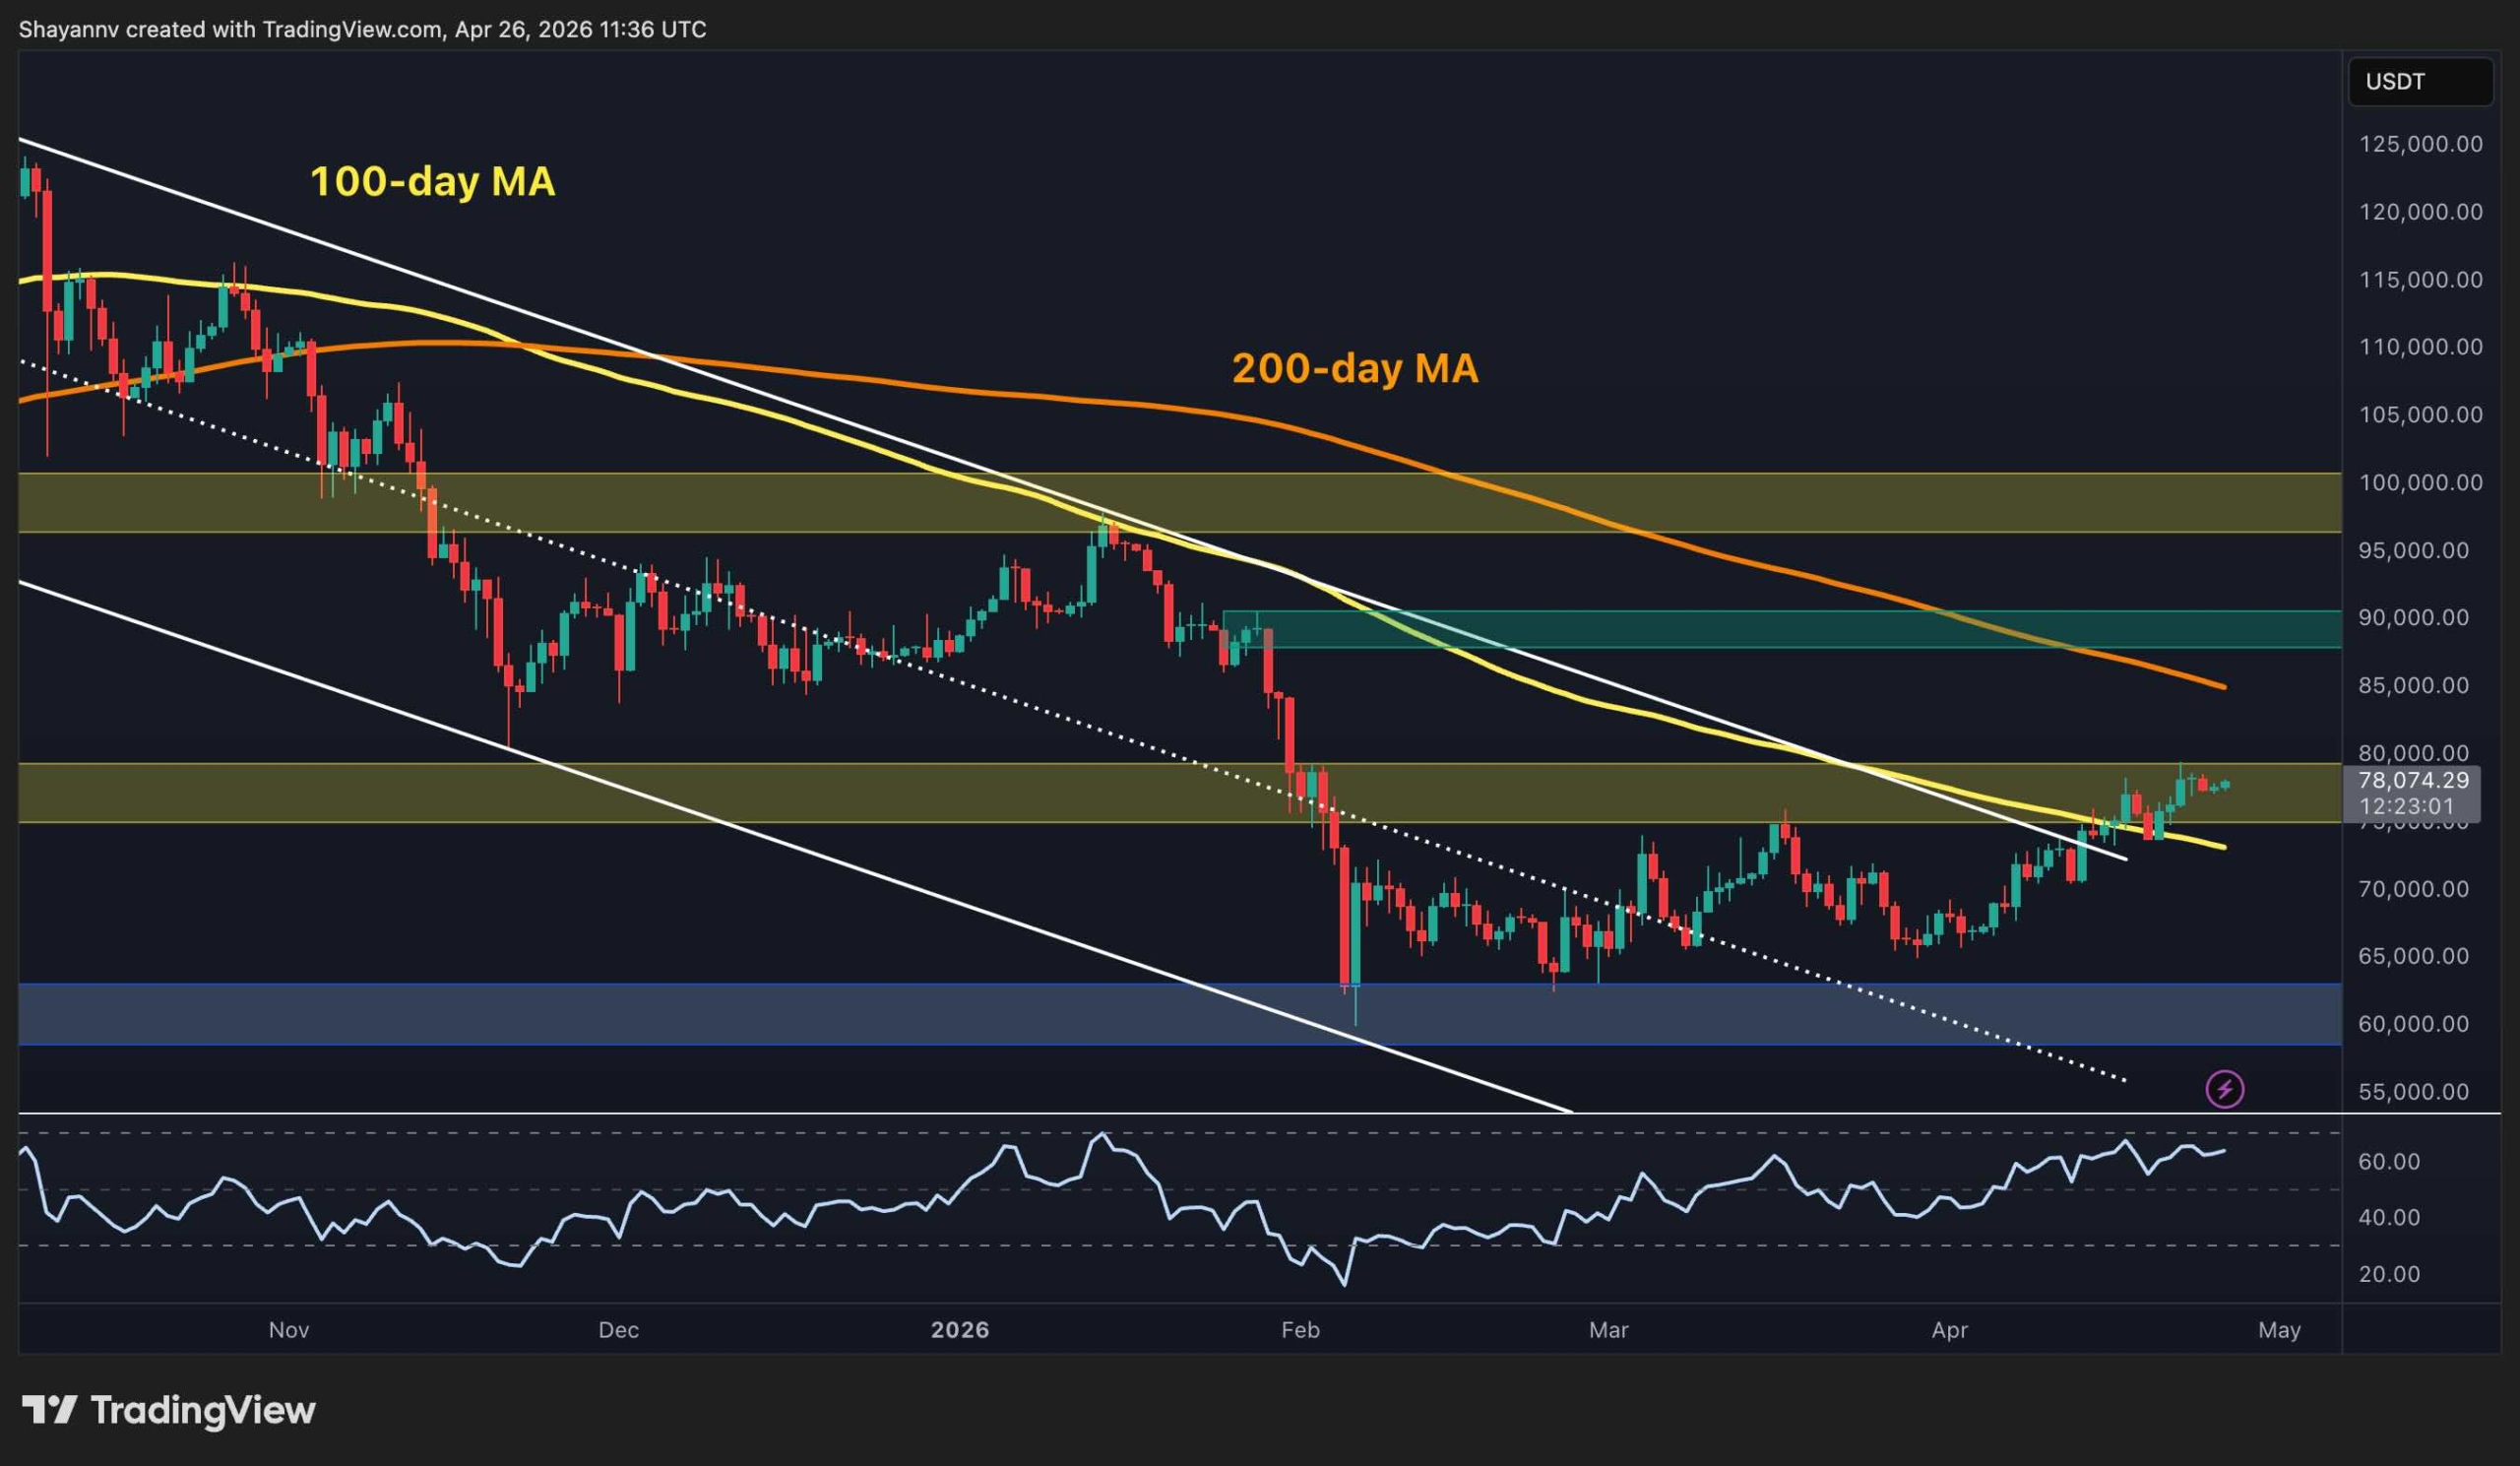
Bitcoin is trading at $78k, closing out the final week of April with a quiet but persistent grind higher that has now taken price above the $75k–$80k resistance band’s midpoint. The move has been orderly rather than explosive, and that measured character, combined with what the derivatives market is currently showing, may actually be setting up a more powerful move than most expect.
Bitcoin Price Analysis: The Daily Chart
The daily structure continues to improve. BTC has now spent several consecutive sessions above the former descending channel, the 100-day MA has been reclaimed, and the RSI is trending upward toward around high-60s, which shows building momentum rather than exhaustion. The $75k–$80k resistance zone is now being systematically reclaimed from within.
The next meaningful test sits at $80k, which is both a psychological round number and the upper boundary of the current resistance band. Above it, the $88k–$90k zone and the 200-day moving average around $85k form a significant supply cluster that can become the primary target.
What is notable on the daily is that each pullback over the past three weeks has found support at higher levels, a classic sign of demand building beneath the price rather than waning. The $74k–$75k area and the 100-day moving average nearby are now the first support levels to protect, as a close below them would be the earliest warning signal that the breakout is stalling.
BTC/USDT 4-Hour Chart
The 4-hour chart has developed an interesting two-layer structure. The broader ascending channel from the February lows frames the overall recovery, while a steeper short-term trendline that emerged in early April has acted as the actual engine of the recent push, driving price from around $68k all the way to current levels near $78k in three weeks.
BTC is currently riding the upper half of the broader channel while the steeper trendline continues to provide dynamic support, now near $77k. The RSI is also hovering around 60, which is elevated but not flashing overbought signals. The upper boundary of the broader channel near $79k–$80k coincides with the key resistance level, making that zone the natural near-term ceiling.
A sustained close above $80k would represent a breakout from both the channel and the psychological resistance level simultaneously, which is a confluence that would carry significant technical weight.

Sentiment Analysis
Sentiment-wise, there is a paradox that the funding rate chart presents. Despite BTC trading at $78k, which is its highest level since February, funding rates across all exchanges remain firmly negative, currently reading around -0.014. The red bar dominance that began in February has not resolved, even as the price has rallied more than 20% from the lows. Traders are still paying to hold short positions at levels that are approaching two-month highs.
This is not a warning sign, but more like a structural advantage for buyers. A market where funding is persistently negative while price rises means the rally is being fought, not embraced, by derivatives traders. Every short position opened against this move is a potential source of forced buying if the price continues higher.
When BTC eventually triggers a wave of short liquidations, and at $78k with heavily negative funding, the threshold for such a cascade is not far away. The buying pressure generated by covering shorts can amplify price moves significantly beyond what spot demand alone would produce. The fuel for a sharp move toward $85k–$90k is sitting right there in the derivatives market, waiting to be ignited.

Binance Free $600 (CryptoPotato Exclusive): Use this link to register a new account and receive $600 exclusive welcome offer on Binance (full details).
LIMITED OFFER for CryptoPotato readers at Bybit: Use this link to register and open a $500 FREE position on any coin!
Disclaimer: Information found on CryptoPotato is those of writers quoted. It does not represent the opinions of CryptoPotato on whether to buy, sell, or hold any investments. You are advised to conduct your own research before making any investment decisions. Use provided information at your own risk. See Disclaimer for more information.