

This report is brought to you in partnership with WEEX Exchange, a platform committed to transparency and innovation in crypto trading. Together, we aim to make crypto more accessible and understandable for everyone.
In Q3 2025, the crypto market grew by 23%, following a 22% rise in Q2. This steady growth came in a quarter that has historically been more volatile than Q1 and Q4. In comparison, global equity markets reached $127.71 trillion in the first half (H1) of 2025, showing only a small increase of 0.4% from the second half (H2) of 2024, and a moderate 6.24% gain from H1 2024.
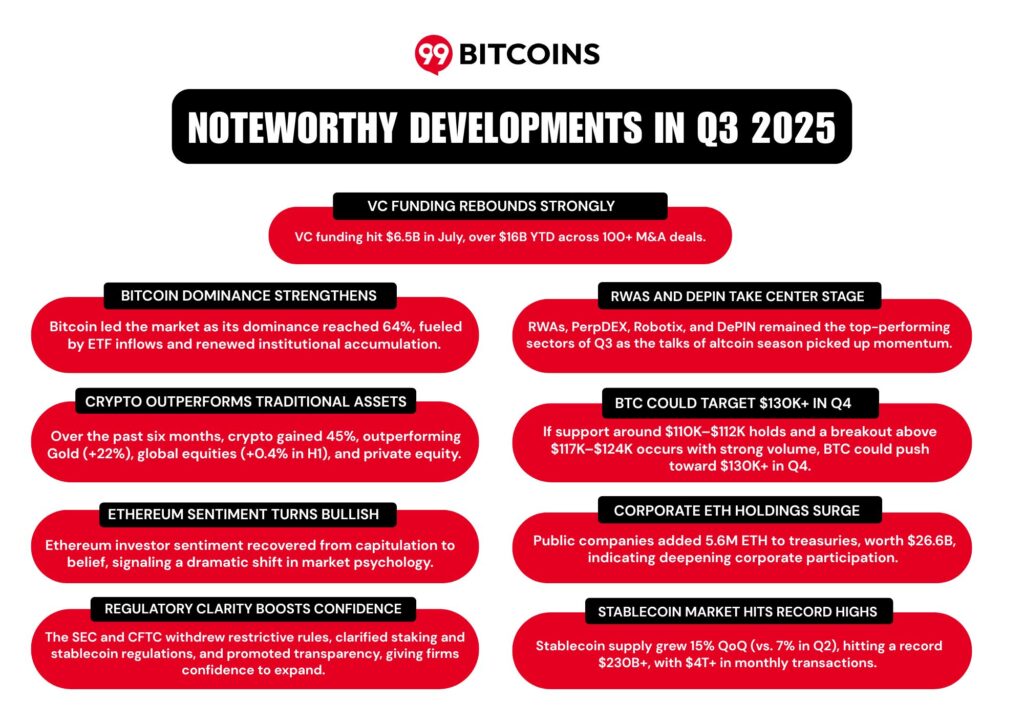
The crypto market also outperformed private equity and Gold. Over the past six months, Gold returned around 22%, while crypto gained more than 45%.
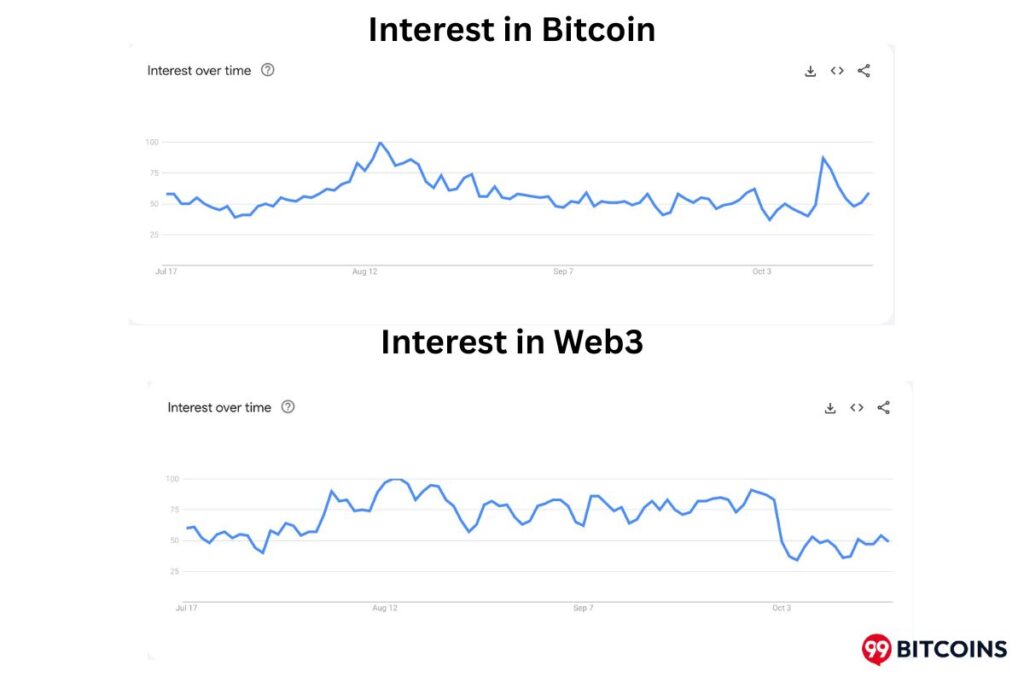
99Bitcoins found that interest in crypto and Bitcoin has dropped compared to the peak during last year’s U.S. Presidential election. While interest is still strong, it hasn’t returned to those levels. In fact, this quarter, people on X talked more about altcoins than Bitcoin. However, Google searches for “Web3” were close to record highs, showing that investors were actively looking for early opportunities.
Interestingly, in August, SEC filings reached an all-time high of 8,110 blockchain mentions, 3620 of which were about Bitcoin. This means more firms are holding, trading, or building products tied to Bitcoin and blockchain. The SEC, at the same time, is paying closer attention and pushing companies to be transparent about any crypto exposure.
Crypto Market Report Q3: Summary
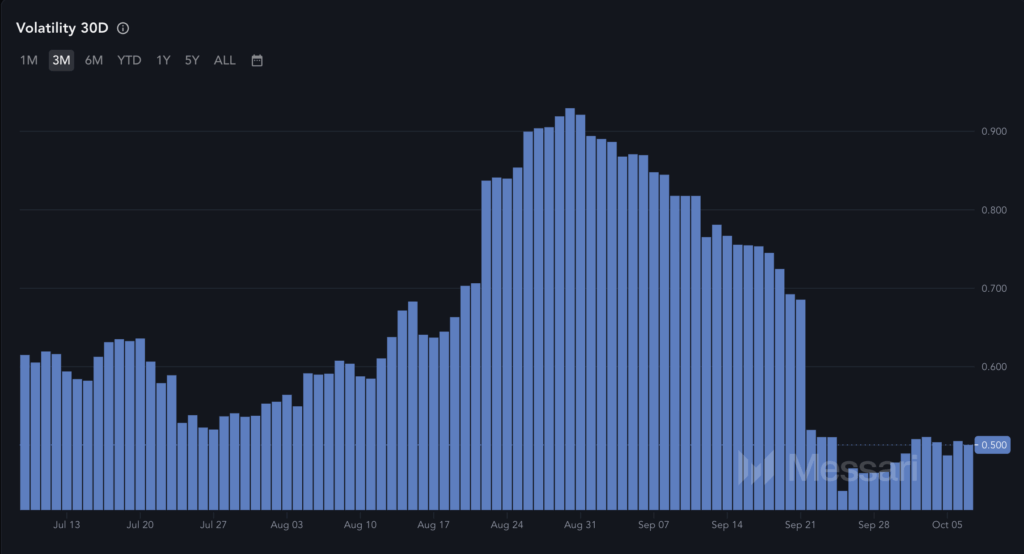
Like the last quarter, institutional adoption continued to gain traction, while retail investor activity was relatively subdued. Most of the money flowed into the top 20 crypto assets, and the talk of an expected ‘altcoin season’ dominated the market sentiment. According to the Crypto Volatility Index (CVI), the market was most unstable in July and the first week of September. But once the interest rate cut was confirmed, volatility dropped noticeably.
99Bitcoins found the risk of stagflation was in the air as trading volumes surged. In July, Centralized Exchanges (CEX) handled about $1.7 trillion while Decentralized Exchanges recorded around $1 trillion, with Solana and Hyperliquid driving much of the activity. That gave DEXs a 37% share of the total trading. In August, however, the picture changed; DEX share dropped to 16.5%, with volumes at $369 billion compared to $1.86 trillion on CEXs, the highest since January 2025. In September, trading activity on both CEXs and DEXs remained strong.
State of the Cryptocurrency Market in Q3 2025
From mid-July to mid-August, market sentiment leaned towards greed. But the fear and greed index stayed in neutral territory for most other trading sessions. 99Bitcoins found Bitcoin’s dominance was relatively strong in July, at around 60%- 65%. By August, it slipped to roughly 59%, and in September, it settled in the 57%- 60% range.
Many long-term Bitcoin holders who had made strong profits started moving some of their money into coins outside the top 10. As a result, the total market cap of all cryptos excluding the top 10 climbed to $343 billion, a level not seen in nine months. Liquidity in Q3 was better than in Q2, but still below the highs of 2024’s November and December. Consider this – daily exchange volume didn’t pass its 23 July peak of $77 billion. On the spot market side, Binance remained the most liquid exchange.
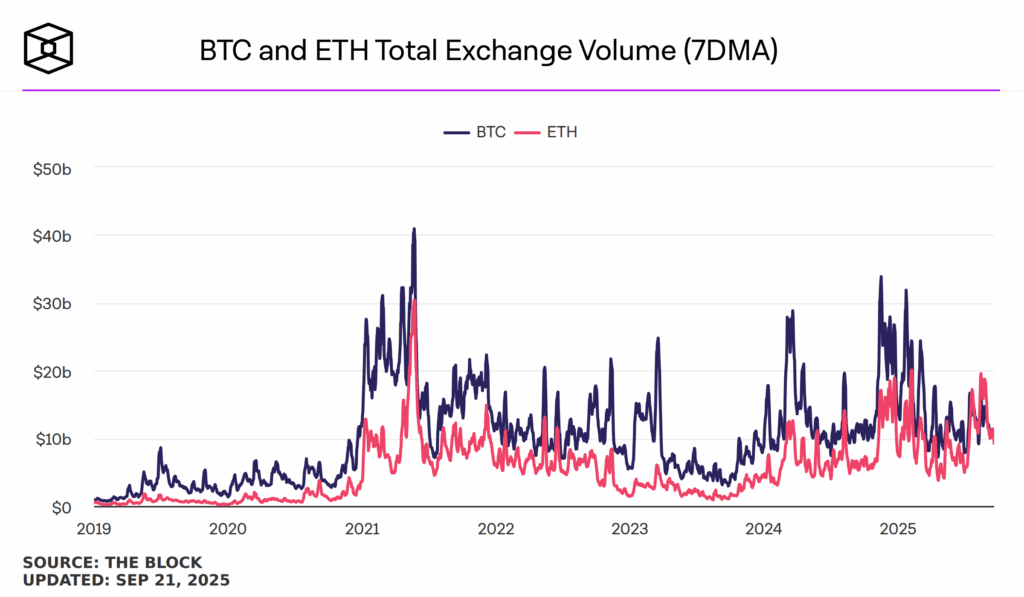
For the first time in history, Ethereum’s total exchange volume overtook Bitcoin’s. This milestone came on 22 July, when ETH recorded $16.94 billion in volume compared to Bitcoin’s $16.64 billion. Ethereum kept its lead throughout August, the same month it reached a new all-time high. However, by September, BTC regained the top spot, but the gap between the two remained small.
This quarter, the stablecoin market grew by about 15%, twice the 7% growth seen in Q2. The total supply hit a record of $230 billion+, and monthly transactions exceeded $4 trillion. This growth was fueled by the U.S. passing the GENIUS ACT in July 2025. This new law has given the stablecoin market a boost by setting clear rules on how they are issued, what reserves must back them, and how issuers report their holdings.
VC Funding in Crypto
Venture Capital Funding in Q3 rose sharply, though it still hasn’t matched the highs of the 2021 bull run. In July alone, crypto projects raised over $6.5 billion, with strong funding continuing through August and September. The comparative decline in VC funding is due to the competition emerging from large financial firms. They are moving deeper into crypto with Stablecoins, tokenization, and DeFi, which is leaving less room for venture capital investors. However, so far this year, crypto companies have secured more than $16 billion and completed over 100 M&A deals. Leo Zhao, Investment Director at MEXC Ventures, told 99Bitcoins,
Today, venture capitalists are naturally much more selective as the focus has shifted from chasing hype cycles to supporting projects with strong fundamentals. While the overall funding volume is below 2021 highs, it’s fair to say that the quality of projects receiving backing today is significantly higher, which will set the foundation for a stronger and more resilient next cycle.
About one-third of the money went into DeFi, launchpads and perpetuals, while the rest went into bigger plays like ETFs, real-world assets and IPO-linked companies. Token listings dropped in 2025; in fact, projects that depend on token launches are struggling to raise funds without strong market traction. Meanwhile, the IPO market has picked up again, with 95 companies going public in the U.S. this year and raising $15.6 billion by mid-June. Almost nine big companies are set to launch their IPOs in 2026 and another nine in 2027. This IPO boom has been mainly supported by favorable regulation in the U.S.
U.S. Policies That Impacted the Broader Crypto Market
Over the past nine months, U.S. government policies have largely favored the crypto industry, bringing several regulatory changes that positively impacted the market. Here are the top policies that you should take note of –
| Date (2025) | Policy | Key Impact |
| 1 Jan | Establishment of the Crypto Task Force |
Launched task force for industry engagement, guidance, and a less enforcement‑first approach.
|
| 23 Jan | Executive Order: Pro‑Crypto Direction |
Ended CBDC exploration, formed President’s Working Group on Digital Asset Markets, and directed agencies to review crypto rules.
|
| 23 Jan | Accounting & Custody Relief (SAB 122 Rescinded) |
Removed onerous accounting/custody rules for custodians and exchanges.
|
| 27 Feb | Staff Statement on Memecoins |
Division of Corporation Finance staff expressed the view that memecoins are not securities, reducing legal uncertainty.
|
| 6 March | Strategic Bitcoin Reserve |
U.S. government created a Strategic Bitcoin Reserve and Digital Asset Stockpile, signaling recognition of Bitcoin.
|
| 20 March | Statement on Proof-of-Work Mining Activities |
The govt. clarified that protocol mining is not considered a securities offering, giving more clarity.
|
| 28 March | Withdrawal of Staff Advisory No. 18-14 |
CFTC scrapped its 2018 guidance, leaving exchanges & clearinghouses more flexibility in listing crypto derivatives.
|
| 4 April | Statement on Stablecoins |
SEC staff clarified USD-pegged payment stablecoins aren’t securities, exempting issuers and redeemers from registration.
|
| 10 April | H.J.Res.25, Disapproval of IRS Rule |
Congress overturned the IRS broker reporting rule, removing tax reporting requirements for DeFi platforms, exchanges, and wallet providers.
|
| 10 April | Statement on Offerings & Registrations of Securities in the Crypto Asset Markets |
SEC staff set clear disclosure rules for companies raising money or registering securities tied to crypto.
|
| 28 May | Rescission of 2022 Guidance on Cryptocurrency 401(k) Plans |
The govt. withdrew its 2022 warning on crypto in 401(k) plans, easing restrictions for fiduciaries to offer crypto investments.
|
| 29 May | Statement on Certain Protocol Staking Activities |
SEC staff clarified that self-staking and certain custodial staking aren’t securities, marking a shift from earlier lawsuits against Coinbase and Kraken.
|
| 12 June | Withdrawal of Amendments to Exchange Act Rule 3b-16 | SEC rolled back plans to classify DeFi platforms as exchanges, removing requirements for them to register under Regulation ATS or as broker-dealers. |
| 12 June | Withdrawal of Safeguarding Advisory Client Assets Rule | The SEC dropped its plan that would have forced investment advisers to store all client crypto with qualified custodians, easing custody rules for digital assets. |
| 1 July | Statement on Crypto Asset Exchange-Traded Products | SEC staff outlined disclosure requirements for crypto ETP issuers, including risks, custodians, fees, management, and financial details under Regulations S-K and S-X. |
| 18 July | U.S. Stablecoins (GENIUS) Act (S.1582) | The GENIUS Act set federal rules for payment stablecoins, requiring 1:1 reserves, monthly disclosures, and AML compliance, while confirming they are not securities. |
The U.S. government’s friendlier approach to crypto and the EU’s MiCA rules have created a significant rise in hiring for compliance, legal, and AML/KYC roles in Web3. Major firms like BlackRock, JPMorgan, and Fidelity are also bringing in more quant traders, risk analysts, and smart contract engineers to grow their digital assets teams. And in 2025, about 70% of all Web3 job placements have been remote.
Bitcoin Market Insights Through Quantitative Analysis
Bitcoin’s performance in Q3 stood out strongly. Over the past year, it gained around 70% after inflation, while over the last seven years, it delivered an impressive 1,250% real return. In contrast, the S&P 500 Global returned about 16% in the past year and averaged 13-14% annually over seven years, when adjusted for inflation. BTC’s 1-year historical volatility remains high at roughly 43%.
In essence, Bitcoin continues to outperform traditional assets. Recent U.S. fiscal developments have strengthened its role as a store of value. In Q2 and Q3, institutions and corporates increased their exposure to BTC. Much of this is happening through U.S. Bitcoin Spot ETFs, which are gradually being integrated into wealth management platforms. Based on Q2 SEC 13F filings,
- Investment advisors managing over $100 million now hold the equivalent of 167k BTC, up 30% quarter-over-quarter.
- Retail still plays a big role; about 75% of ETF AUM (assets under management) is held by non-13F filers.
- The long-term trend looks very clear: advisors are increasingly allocating a specific portion of client portfolios to Bitcoin.
13F filer data showed that there was $33.4 billion in BTC ETF holdings at Q2 end, up 57% from $21.2 billion in Q1. The broader U.S. Bitcoin ETF market grew 45% to $103 billion AUM, with institutional share rising slightly to 24.5%. Meanwhile, Europe is still trailing the U.S. in the crypto ETF/ETP space, though there are signs of movement. 99Bitcoins spoke with André Dragosch, Bitwise’s Head of Research – Europe, to understand the main hurdles preventing European institutions from allocating more significantly to digital assets. He explained,
One of the key drivers of adoption tends to be social proof – it sounds trivial but “keeping up with the Joneses” is an important part of the institutional adoption of cryptoassets. That is why the launch of the Bitcoin ETFs by the likes of Blackrock and Fidelity in the U.S. have been so powerful. I think European regulation is already very benign and the EU MiCA guidelines have already created regulatory clarity.
Looking at how fiduciaries have behaved over time, André opined,
The infrastructure to invest via ETPs is already well established. That being said, I think it will take a bit more time though until positive performances of those managers that have invested into cryptoassets will be significantly higher than those that didn’t. But I am convinced that not investing into cryptoassets will increasingly become a career risk for asset managers because of increasing pressure from competitors and clients.
While Europe is taking a wait-and-see approach, U.S. 13F filings detailed notable moves by big players in the U.S. Consider this –
- Brevan Howard shifted from a hedge fund to an investment advisor and boosted holdings from 12.3k BTC to 21.4k BTC.
- JPMorgan disclosed its first position, 1.9k BTC equivalent.
- Wells Fargo expanded its exposure nearly 5x to 1.7k BTC equivalent.
- Harvard made its first reported allocation to Bitcoin.
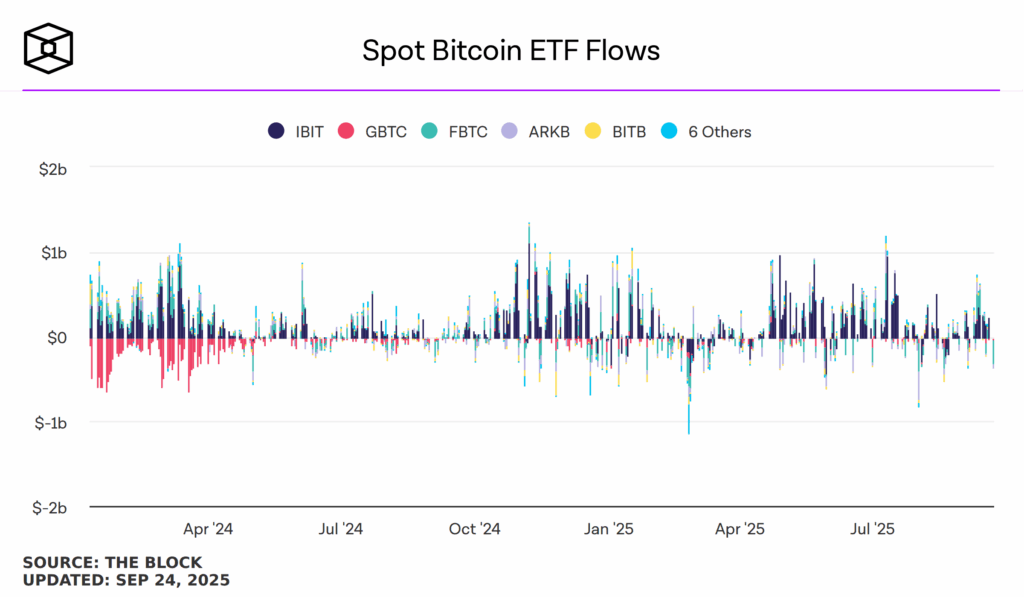
On 10 July, spot Bitcoin ETFs recorded $1.2 billion in inflows, the second-largest single-day inflow in ETF history. July overall ended net positive, with most of the inflows coming from BlackRock’s IBIT. By contrast, 1 August marked the second-largest outflow on record, totaling $812.3 million. In September, inflows picked up again, with several days exceeding $500 million, signaling a renewed demand. Still, volatility persisted; on 22 September, ETFs saw a sharp $363 million outflow. In all, September remained net positive but highly volatile, with Grayscale’s GBTC contributing the most to outflows as investors continued rotating into cheaper ETF options.
Analyzing Bitcoin’s Price Action: Technical Outlook
Bitcoin’s Q3 price action has been defined by reversal patterns (double-top, head and shoulders) and range-bound trading between $105k-$123k. Bitcoin’s daily chart was dominated by the formation of higher-highs, and buyers had an upper hand for most of the trading sessions.
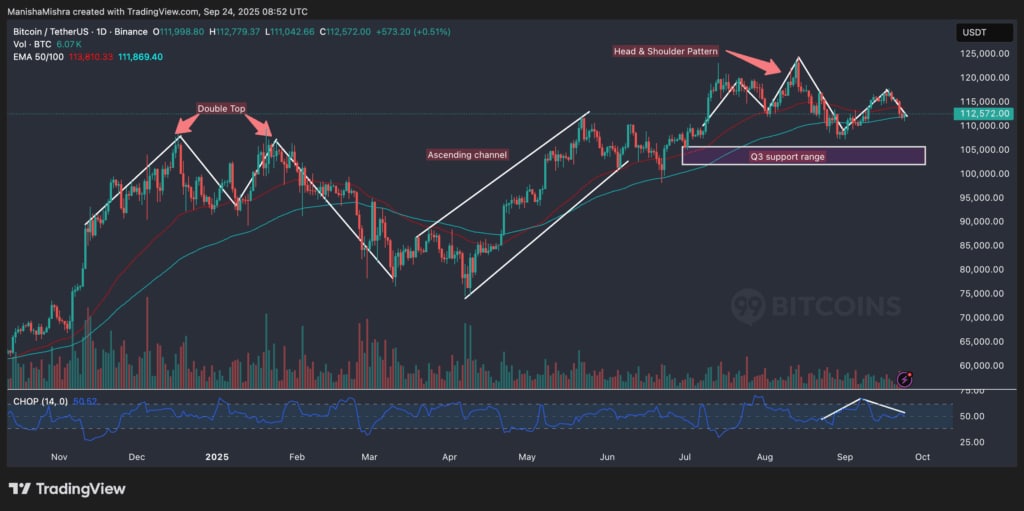
Around the $110k level, Bitcoin formed a double top, signaling a bearish reversal and sparking a sharp correction through late January and February. From there, BTC rebounded into an ascending channel, climbing steadily from $80k to $112k with strong bullish momentum, rising volumes, and support from the 50 and 100 EMAs. Riding this buying pressure, Bitcoin pushed to a new all-time high of $123k. However, the rally stalled as a head and shoulder pattern emerged, triggering another downside move that pulled BTC back to test the $107k support level. In the early week of October, though, bulls took over and BTC marked a new all-time high of $126,199.
Support, Resistance & Indicators
- Q3 Support Range – $101k-$110k demand zone has been tested multiple times, and remains a critical area for buyers.
- Resistance – $118k to $123k remained a supply zone, where the head and shoulders neckline and prior highs created a strong resistance barrier.
- EMA 50/100: Throughout July, BTC used the EMA 50/100 as strong support. But by mid-August, it slipped below the 50 EMA and closed under the averages several times. In early September, BTC briefly reclaimed the EMAs, only to reverse again and treat them as near-term resistance by late September.
- Choppiness Index (CHOP): The indicator showed BTC trending strongly in July, turning choppy during August’s sell-off, then moving neutral in September. This shift highlighted weakening momentum, with BTC stuck between strong $105K support and heavy $118K-$123K resistance.
Inside Bitcoin’s Derivatives Market
Bitcoin’s derivatives trading volume stayed strong across futures, options, and perpetual markets. In August 2025, BTC futures volume across all exchanges reached $1.74 trillion, with Binance leading volumes throughout the year. Interestingly, ETH’s futures trading volume surpassed that of Bitcoin’s in majority of Q3. This showed investors were more interested in speculating on ETH’s price moves.
Bitcoin options trading volume hit a record high of $144 billion in August. Of this, Deribit handled $114 billion. At the same time, BTC’s implied volatility (the market’s forecast of price swings) kept falling. Meanwhile, Deribit’s total open interest in Bitcoin options rose to $52 billion, its highest level since 2021. This means more money was locked into outstanding contracts, signaling confidence and deeper liquidity in Bitcoin’s options market.
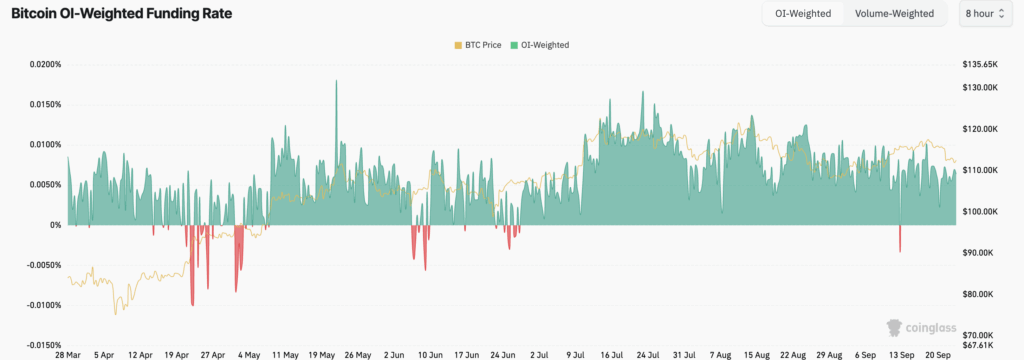
For most of this quarter, funding for perpetual futures remained positive, highlighting that longs dominated and traders stayed bullish. Occasional dips into negative territory reflected short-term bearish bets during price drawdowns. Interestingly, in July, when Bitcoin hit a high of $124k, funding rates spiked higher, highlighting strong long positioning. Some analysts argue that the market is overheated, and a potential long squeeze could soon be on the horizon if sentiment shifts.
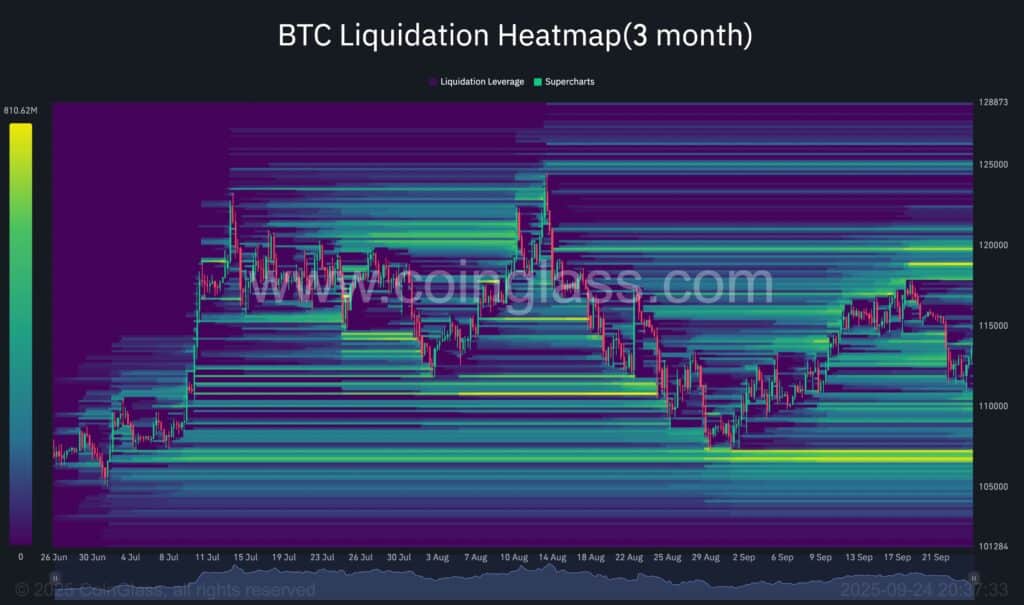
In Q3, Bitcoin’s liquidation heatmap showed heavy clusters forming around the $113k-$114k zone, where many short positions were built up. Each time BTC pushed towards this level, it triggered short squeezes, which in turn drove prices higher. This made the area a key pressure point for the market.
On the downside, the $105k-$111k range emerged as a liquidation pocket for over-leveraged longs. When BTC dipped into this zone, long liquidations added to the selling pressure and pushed the market down. Overall, the quarter was pretty much shaped by this tug-of-war between liquidation bands.
Key Factors Behind Bitcoin’s Price Move
Bitcoin’s price action was driven by a mix of forces, from macroeconomic trends and on-chain activity to geopolitical tensions, the global trade war and the U.S. policy decisions. Bitcoin has completed four cycles that each included both bull and bear markets. For about two years, BTC’s price movement in the 2022-2025 cycle looked very similar to how it moved during 2015-2018. But in Q1 2025, it diverged; instead of continuing to mirror that past cycle, the price started moving differently.
Macroeconomic Factors
Global debt reached a record $324 trillion in May 2025, which is more than 235% of the world’s GDP. At the same time, trust in governments, banks and the media has fallen sharply. U.S. bond yields are rising at historic prices, and almost the same is the case with other G7 countries. Billionaire investor Ray Dalio calls this stage the long-term debt cycle, while historians William Strauss and Neil Howe describe it as the Fourth Turning, a period of major change that tends to happen every 20 years or so. Even the use of divisive language has risen by over 500% since 2010. All of this data shows that investors are gradually losing faith in debt-fueled economies and are increasingly turning to Bitcoin.
In fact, the U.S. now spends more on interest payments for its debt than on its entire defence budget. The Federal Reserve’s balance sheet also shows a sharp decline in U.S. assets. Meanwhile, the dollar’s global dominance is weakening. BRICS countries are increasingly settling trades in their local currencies; about 90% of their commerce now uses local currencies, up from 65% just two years ago.
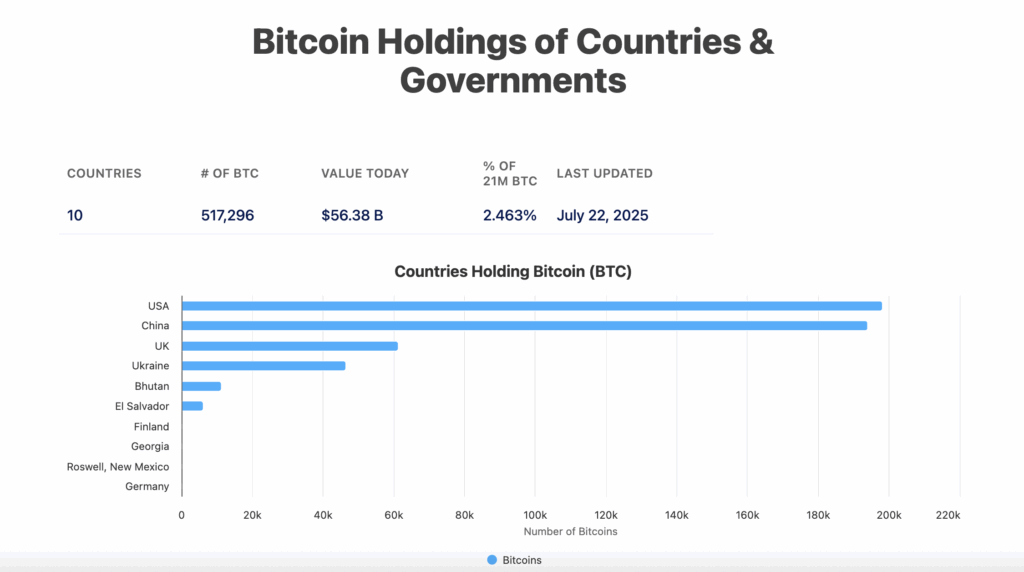
Many countries are also reducing their reliance on the U.S. dollar as a reserve currency, while sovereign wealth funds are buying more Bitcoin than ever before. Governments now hold about 517,296 Bitcoin, which is 2.46% of the total supply. The U.S. is the largest holder with 1,980,000 BTC, followed closely by China with 1,94,000 BTC. Even the world’s largest sovereign wealth fund, Norway’s Norges Bank Investment Management, increased its Bitcoin-related holdings by 83% in Q2.
More than sovereign wealth funds, corporations are putting a larger share of their money into Bitcoin, with many making it a key part of their treasury reserves. The value of these Bitcoin treasury companies has been rising very quickly, which is becoming a matter of concern for many analysts.
Strategy is the clearest example, holding over 630,000 BTC (worth more than $70 billion as of September), while its stock price has jumped more than 1000% in just two years. Many experts think that such a heavy concentration of Bitcoin in a few companies also increases the risk of market instability. Altogether, Bitcoin treasury companies now hold over 1 million BTC, or about 4.7% of the total supply, with Strategy alone controlling 2.7% of all Bitcoin.
Fed Rate Cuts, Inflation Pressure & Weak Economic Data
The U.S. money supply is near record highs, adding to inflation and widening the wealth gap. At the same time, the U.S. government’s high tariffs have made imported goods more expensive. Economists warn that this could cause even more inflation and a higher interest rate in the long run. For now, though, the tariff-driven rise in prices is already pushing investors to seek safer stores of value than dollars, which is indirectly boosting demand for Bitcoin.
The Fed’s looser monetary policy has also added to inflationary pressure. Manufacturing stayed weak through the summer: the PMI came in at 49% in June, dipped to 48% in July and edged up slightly to 48.7% in August, all signaling contraction. By contrast, the services sector showed modest growth, with the services PMI at 50.8% in June and 50.1% in July, marking two straight months of expansion.
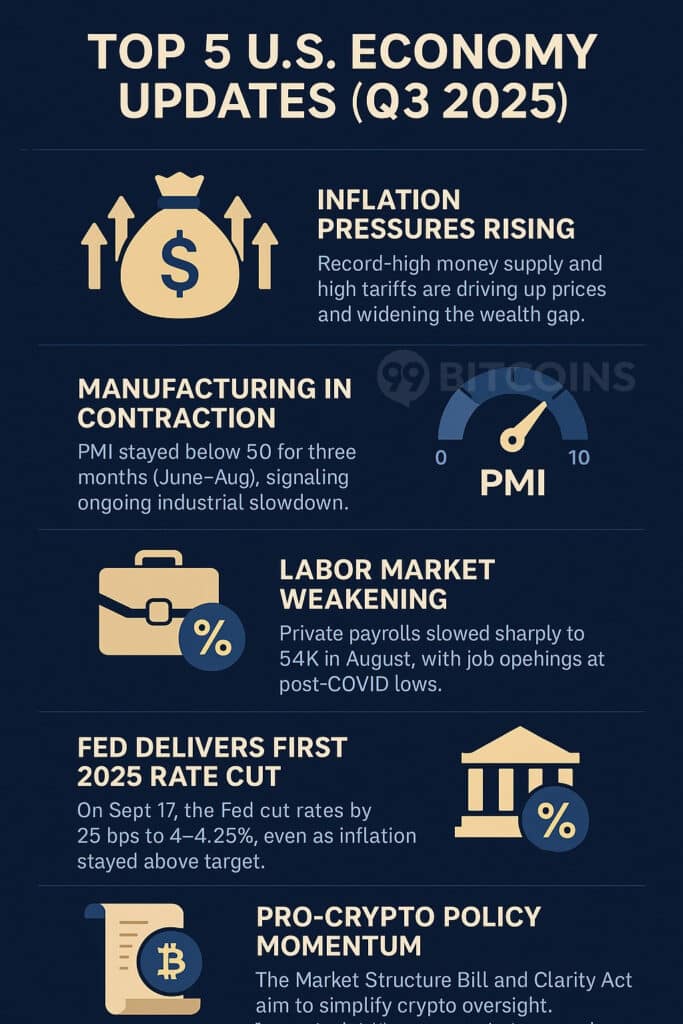
The labor market softened, and private sector payrolls rose by 1,04,000 in July but slowed to just 54,000 in August, well below expectations. Jobless claims hovered around the 218,000-229,000 range between late July and September, showing only slight movement. Non-farm payrolls averaged just 29,000 new jobs per month in the three months to August, far weaker than last year’s 82,000 pace. Meanwhile, job openings fell in July to their lowest level, rarely seen since the COVID-19 pandemic, confirming the slowdown.
In response, the Fed cut rates on 17 September by 25 basis points to 4%-4.25%. It was the first rate cut of 2025 and notably the first time the Fed cut the interest rate when inflation remained above its target.
On the policy front, the upcoming Market Structure Bill and the Clarity Act will make crypto rules clearer. They explain whether the SEC or CFTC should oversee certain digital assets, set limits for exemptions, and create a more organized system for launching and trading tokens. For Bitcoin, the main benefit is this clearer rulebook. Many institutions have stayed away because of confusion, but with more certainty, fresh money could flow in, liquidity will go up, hence pushing BTC’s price upwards.
Interestingly, even the Big Beautiful Bill will bring more liquidity to the crypto market, which may boost BTC’s demand in the long term. 99Bitcoins spoke with Markus Levin, Co-Founder of XYO, the first crypto project approved by the SEC under Reg A, who explained,
The Big Beautiful Bill is a complex piece of legislation, and covers various areas, but the most pertinent for the digital assets industry are tax cut extensions. By extending the 2017 tax cuts and raising the SALT deduction cap, and proposing no tax on overtime or tips and other elements the bill delivers more disposable income to both households and higher earners.
Further, U.S. lawmakers are pushing the SEC to implement Trump’s executive order, which would allow Americans to add Bitcoin and other cryptocurrencies to their 401(k) retirement plans. If approved, the impact could be huge. Each year 401(k) plans see about $550 billion in new contributions. Even a small 5% allocation to Bitcoin could bring in $30-$40 billion annually, adding up to around $343 billion by 2035, over six times the inflows that U.S. spot Bitcoin ETFs have attracted so far.
Lastly, we must also note that geopolitical tensions like the Russia-Ukraine war and the Israel-Gaza conflict have indirectly strengthened Bitcoin’s appeal. These crises have reinforced its role as a store of value and a hedge against uncertainty.
On-Chain Factors
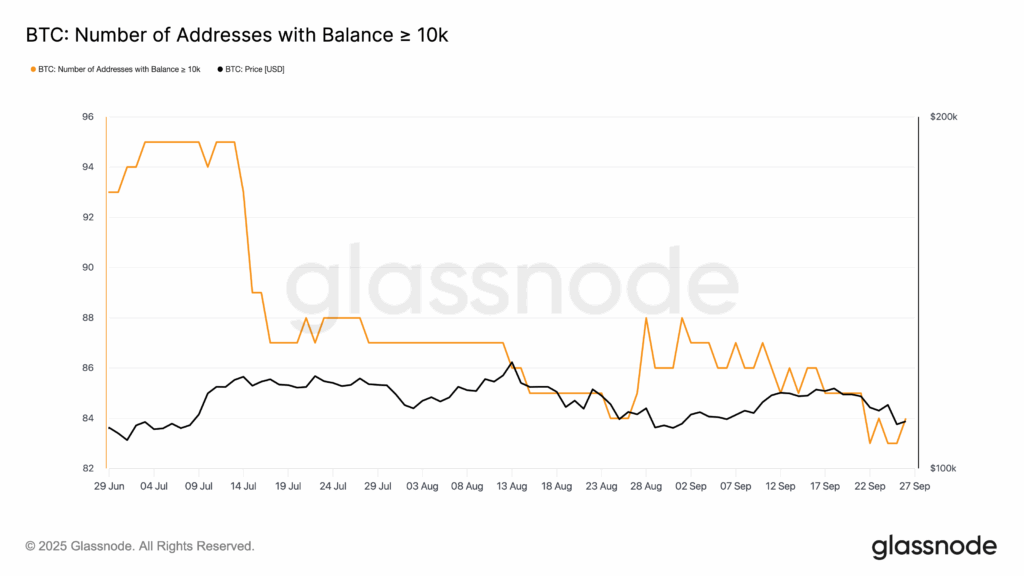
Bitcoin’s liquid supply (coins moved within three months) rose by 12% in Q2, while the illiquid supply (coins held for over a year) dipped only 2%. Since January, Bitcoin exchange reserves have steadily declined, reflecting strong HODLing in Q3 despite a brief profit-taking spike in mid-August. By late September, 92% of addresses were in profit, though the number of wallets holding more than 10,000 BTC fell sharply, especially during the 15-16 July sell-off.
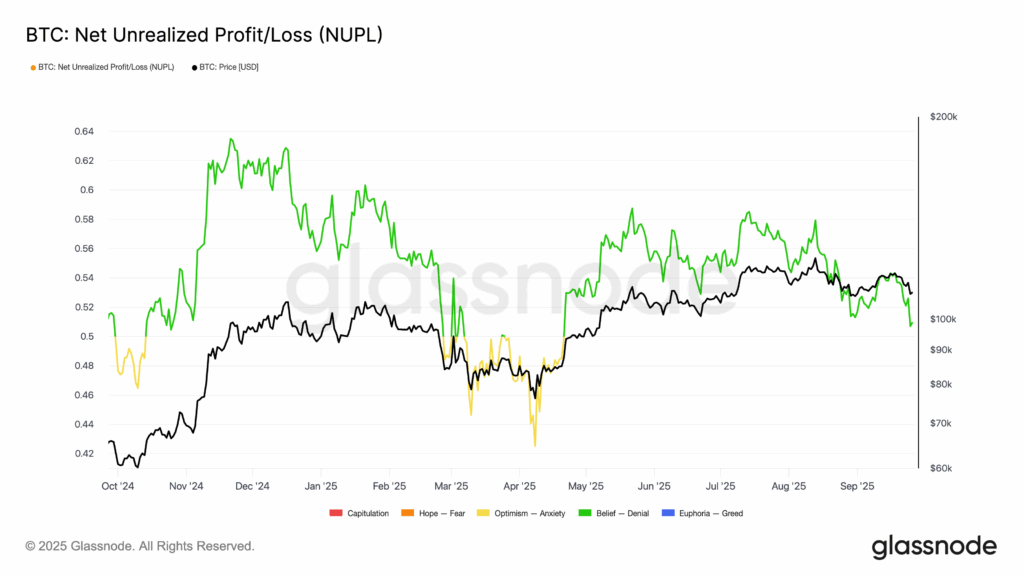
For the entirety of Q3, the Net Unrealized Profit/Loss (NUPL) metric stayed in the green, showing that most investors were sitting on profits. This level is often called the belief-denial phase. In this stage, confidence in the market grows as prices rise, and the investors start to believe that the bull run could continue. At the same time, some remain cautious, thinking the rally might not last. It’s usually a transitional stage where optimism builds, but not yet at the euphoria levels seen near market tops.
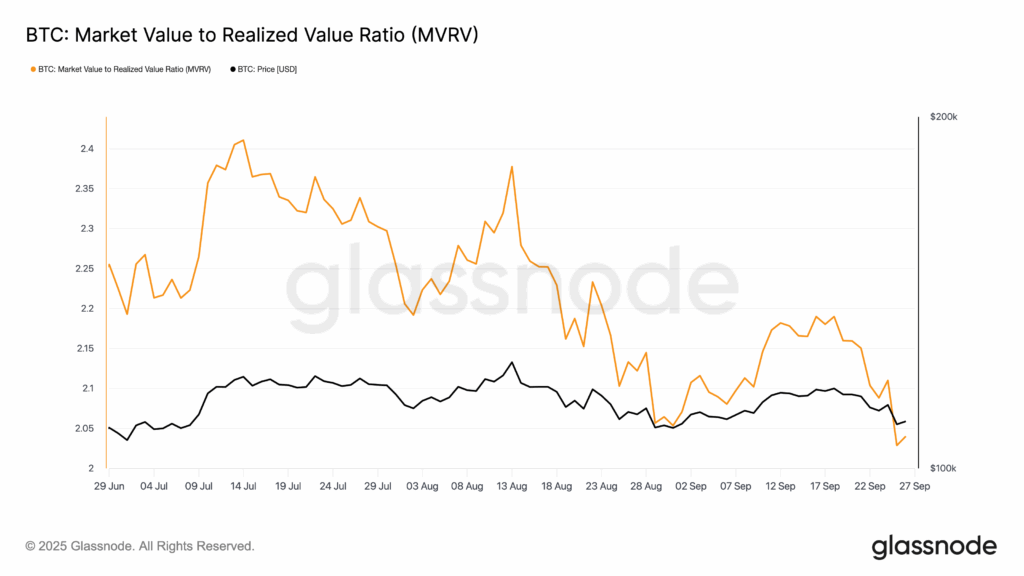
After mid-July, MVRV trended lower even as price held steady around $100k-$110k, suggesting new buyers were entering at higher costs while overall profitability declined. By late September, both price and MVRV dropped sharply, showing a reset in market value. Overall, Q3 began with substantial profits and confidence but ended with shrinking margins and increased selling pressure.
Bitcoin’s social dominance declined in August even as transaction volumes stayed high. Miner revenues held at elevated levels, with monthly electricity consumption also remaining strong. At the same time, whales continued to grow their holdings steadily.
What to Expect From BTC in Q4?
Even though there has been significant profit-taking, the demand for BTC is way higher. Companies investing in Bitcoin are buying far more than miners are producing, which is pushing prices higher. Miners create about 900 BTC per day, but businesses are buying around 1,755 daily, with ETFs adding another 1,430 on top of that. Bitcoin in Q4 has a higher probability of sideways to bullish action, with the base case being a range between $110K-$130K.
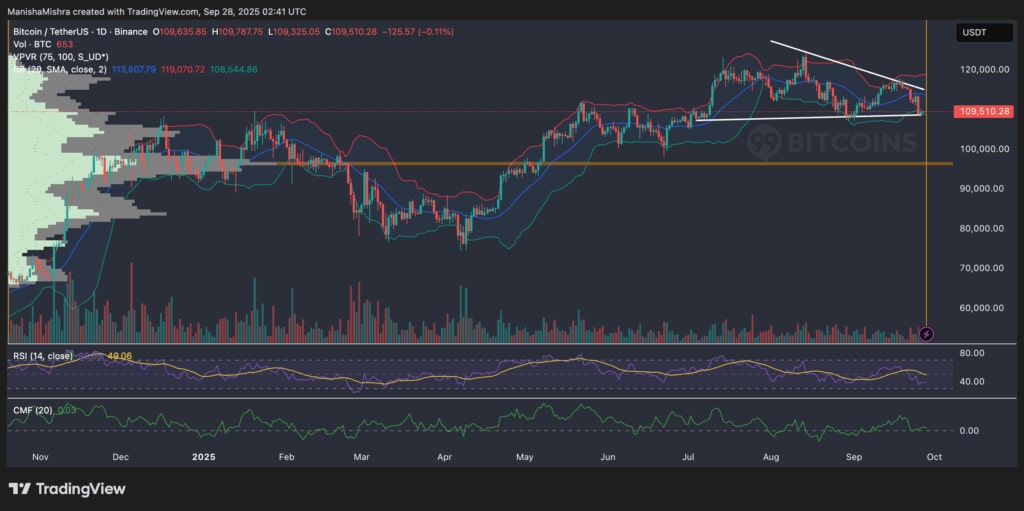
Price: $109.5K, sitting at a key horizontal support zone (white line).
Trend: Lower highs since July, descending structure (mild downtrend).
Indicators:
- RSI (49) – Neutral, no momentum edge.
- CMF (near 0) – Capital inflows are flat, no strong accumulation.
- Bollinger Bands – Price testing the mid/lower band, volatility compression possible.
- Volume Profile (VPVR) – Big support zone near $100K, major liquidity pocket.
Chart Pattern: Price is squeezed between descending resistance and horizontal support, a triangle structure forming.
Probabilities for Q4
As per the technical chart, we can look at three probabilities in the upcoming quarter.
Base Case – Range/Gradual Recovery (45%)
- BTC holds the $105K-$110K support range and slowly grinds higher.
- Likely resistance zones: $115K, then $120K.
- Fits with neutral RSI and sideways CMF, more consolidation than breakout.
Bullish Breakout – Push toward $130K (35%)
- If BTC breaks the descending trendline ($115K), momentum buyers could step in.
- First major target at $125K-$130K. It could go even up to $138k
- Would likely need macro tailwinds (the two anticipated Fed cuts and strong risk-on appetite).
Bearish Case – Drop to $95K-$100K (20%)
- If the $105K-$110K support cracks, VPVR shows the next liquidity cluster at $95K.
- This would align with sellers forcing a deeper correction before the next leg up.
Key Levels to Watch in Q4
- Support: $105K (immediate), $100K (strong), $95K (critical).
- Resistance: $115K (trendline), $120K, $130K (extension target).
From the macroeconomic perspective, we think Bitcoin could reach $150k-$160k by Q4, and the low could be $60k-$72k.
- Typically, Bitcoin’s four-year cycle peaks 15-18 months after a halving. The last halving was in May 2024, yet it’s still unclear if the top has been reached. If the traditional cycle holds, the peak could come around November-December 2025. However, there’s also the possibility of a lengthening cycle, which might push the top into Q1 or Q2 of 2026.
- On the technical side, the 200-week moving average has historically been a reliable signal for Bitcoin cycle tops. Each time it has crossed a previous all-time high, it has marked the peak with 100% accuracy. Based on this pattern, if we project forward on the chart, the next cycle top could align with June-July 2026.
- Looking at Bitcoin’s yearly percentage change, a clear pattern stands out, three years of bull market gains followed by one bear year with a big drop. In 2021, the last year of the bull run, BTC still grew 61%. If we assume a similar 60% gain this cycle (being conservative), and since Bitcoin started 2025 at $98K, that would point to a year-end target of around $150K-$160K if the cycle top lands in Q4.
- We also need to consider the Global Liquidity Index (GLI), which tracks the overall flow of money in the world economy through measures like central bank balance sheets, credit growth, and money supply. Bitcoin has shown a strong correlation with this index, typically reacting with about a 75-day lag.
The Mayer Multiple compares Bitcoin’s price to its 200-day moving average. Historically, it has shown diminishing returns each cycle, meaning the peaks are getting smaller over time. Based on this pattern, if the Mayer Multiple and 200-day MA relationship holds, it points to a possible cycle top of around $220K by June. This outlook matches the view of Juan Leon, Senior Investment Strategist at Bitwise, who told 99Bitcoins,
If the macro backdrop is favorable and we see continued approval of BTC ETFs on major wirehouse and wealth management platforms driving adoption, along with continued ramp up in BTC treasury company adoption, we could see BTC rally to $200,000 or above in Q4 2025/Q1 2026.
Ethereum Q3 Review and Insights
Ethereum performed exceptionally well in Q3, showing strong upward movement on its daily chart. After rising about 31% in Q2, it surged by over 70% in Q3. It even hit a new all-time high of $4,956 on 24 August, thus bringing fresh optimism into the market.
The Total Value Locked (TVL) on Ethereum grew steadily from $63 billion on 1 July to $89 billion by 30 September. The liquid staking protocol Lido maintained its lead with $40 billion in TVL, followed by AAVE at $36.83 billion. In terms of revenue, Tether held the top spot with $22.53 million, while Circle generated $7.82 million. Meanwhile, Uniswap recorded the highest trading volume among all the protocols.
ETH’s volatility has gone up by 10.43% over the last year. It stayed moderate in July 2025, spiked in August, and eased back down in September.
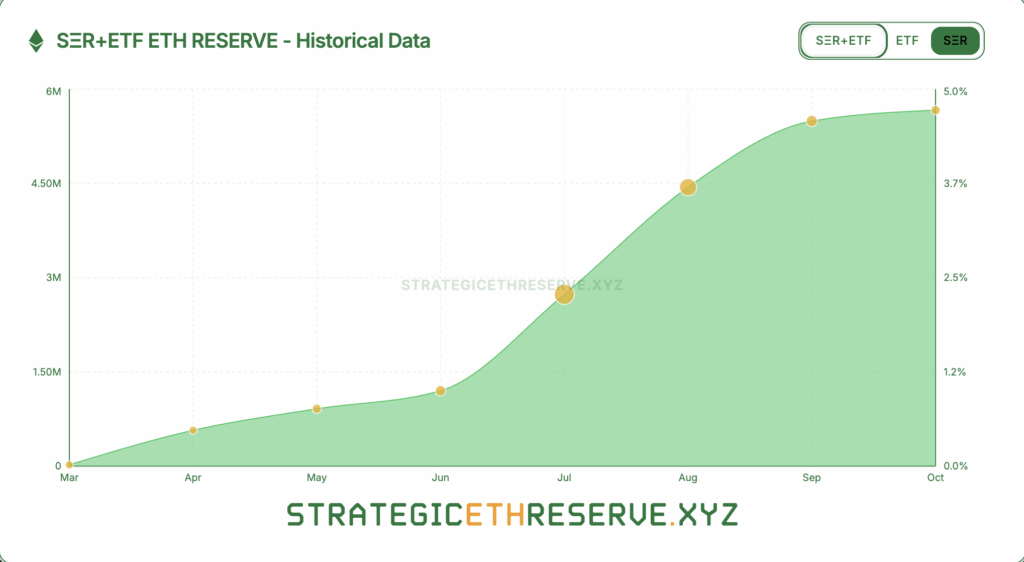
Starting in June, the total value of ETH staked saw a sharp increase of nearly $2 million. Ethereum spot ETFs also performed strongly, with total Assets Under Management (AUM) reaching $25.79 billion. ETF-related trading activity remained robust, with the highest daily volume to date recorded at $7.27 billion on 22 August. Since their launch, net inflows have totaled 3.82 million ETH, while on-chain ETF holdings stand at 6.75 million ETH. Overall, ETH ETFs account for 5.45% of the current supply, with an annualized supply absorption rate of 3% over the past month.
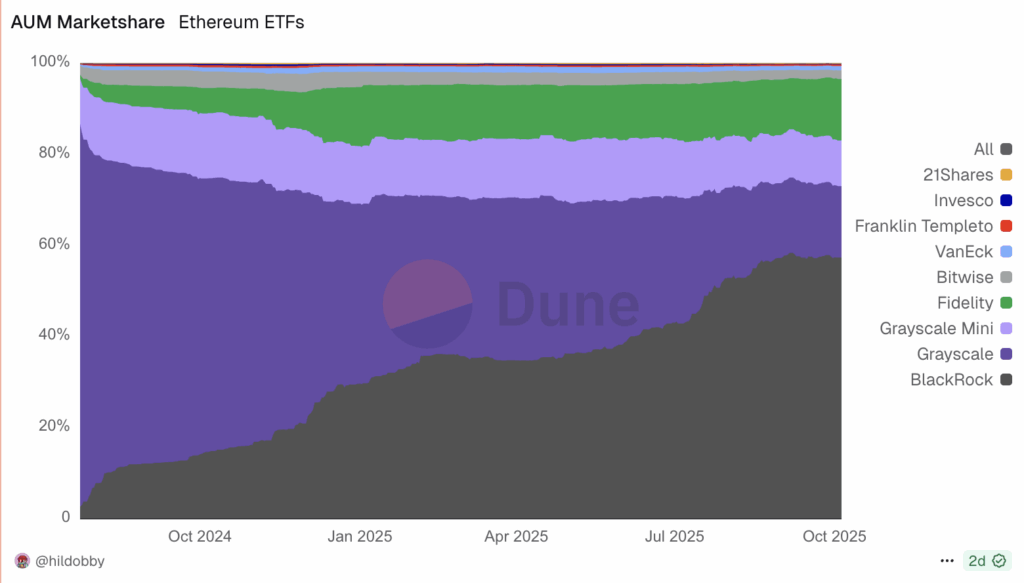
Among all ETH ETFs, BlackRock’s ETHA has dominated the market, accounting for an average of 57.3% of total ETF trading volume. Grayscale’s ETHE followed in second place with a 15.7% share.
Experts believe the recent rise in popularity of ETH ETFs is mainly due to the GENIUS Act, which has provided clearer regulations for stablecoins. Since Ethereum holds the largest share of stablecoin supply among all Layer 1 blockchains, it’s expected to benefit the most as stablecoins become more widely used.
Ethereum also leads in tokenized total value locked (TVL), another fast-growing area in crypto. With strong growth potential in both stablecoins and tokenization, investors see Ethereum as being well-positioned to take advantage of both trends.
In Q3 2025, several publicly traded companies announced plans to add Ethereum to their treasuries, similar to how many already hold Bitcoin. Together, they accumulated 5,663,855 ETH (worth $26.61 billion, or 4.68% of the total supply) by the end of the quarter. This made Ethereum a key asset on many corporate balance sheets, and the trend is expected to grow even faster in Q4.
Ethereum’s network fees have been on a steady decline since peaking during the last bull market in Q4 2021. In Q2 2025, fees dropped to multi-year lows in both ETH and USD terms. Network fees in ETH fell 37% quarter-over-quarter (QoQ) while fees in USD decreased 53% QoQ, dropping from $216.4 million to $102.3 million.
This decline was mainly driven by users moving their activity from Ethereum Layer 1 to Layer 2 networks and other competing Layer 1 blockchains. Among these, TRON ($165.2 million) and Solana ($121.2 million) were the only L1s that recorded higher network fees than Ethereum in Q2. In a way, we can also say that investors are rotating their capital from ETH to other high-quality altcoins. Polygon Labs’ Global Head of Payments, Aishwary Gupta, confirmed to 99Bitcoins,
DeFi is in a ‘quality rotation.’ TVL is consolidating into protocols with real fees, better risk controls, and asset-backed yields (T-bills, credit, RWAs). Expect fewer mercenary incentive loops and more chain-abstracted front-ends that route to the best price/liquidity under the hood. The catalysts: fiat-on/off ramps embedded in wallets, compliant KYC pools for institutions, and RWAs providing durable base yields that stabilize DeFi cycles.
Ethereum’s Network Overview
The total number of transactions on the Ethereum network hit an all-time high of 51.77 million in August, with active addresses also reaching their peak during the month. However, the number of new addresses declined, suggesting that Ethereum’s activity was driven mainly by existing, experienced users rather than new retail participants, reflecting a more mature user base.
Ethereum’s on-chain volume rose QoQ, reaching its year-to-date high of $15.41 billion on 15 August. Since May 2025, the percentage of ETH supply in profit has also been on the rise. At the same time, the total number of deployed smart contracts has continued to grow steadily since March, reflecting ongoing network development.
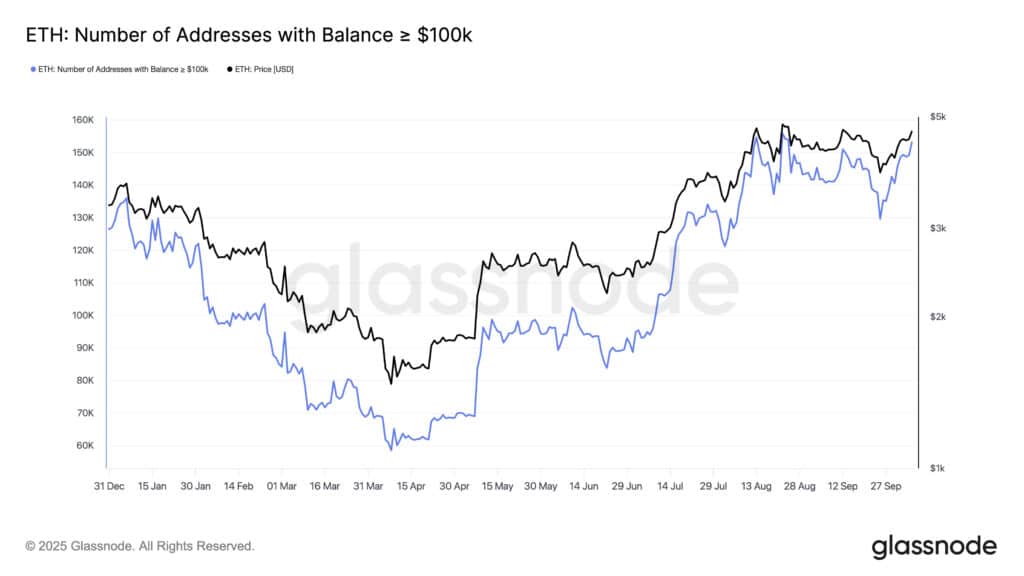
Interestingly, the number of addresses holding more than $1 million in Ethereum rose sharply in Q3. In Q1, these addresses had declined, and Q2 showed only slight growth, but Q3 saw a surprising jump. The same trend was seen in addresses holding more than $1,000 or $100,000.
This increase suggests that both whales and retail holders added more Ethereum to their wallets. It also shows growing confidence in Ethereum’s future, driven by positive market sentiment, ETF developments, and stronger fundamentals.
From a broader economic view, easier monetary policies and higher government spending are creating plenty of liquidity in the market. This has made risk assets like Ethereum and Bitcoin more appealing to investors. At the same time, AI and tech stocks are soaring, driving more money into assets that can protect against inflation. However, much like in 1999, this wave of excitement comes with both optimism and uncertainty, as volatility and rising valuations are taking place side by side.
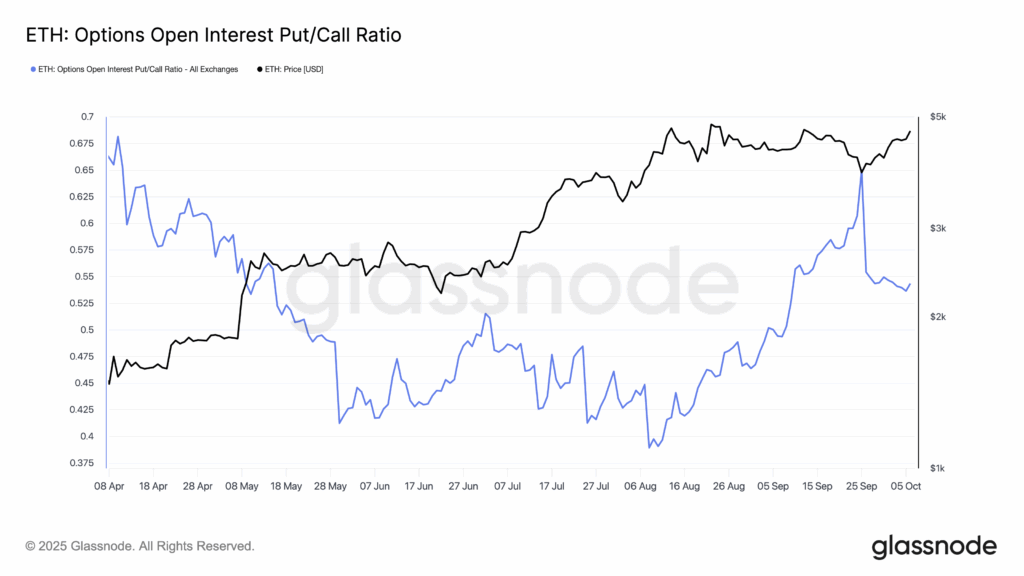
The core logic of this bull cycle has shifted from “fundamentals-driven” to “liquidity and sentiment-driven.” On the derivative side of the market, we saw investors’ growing confidence through Q3. From April to early August, the Put/Call Ratio declined, indicating rising bullish sentiment as ETH’s price climbed steadily. Around mid-September, the ratio spiked, suggesting a temporary rise in bearish bets. This was a time when traders were hedging after strong price gains. After that, the ratio dropped again, showing that optimism returned as ETH prices neared $5000 level.
What’s Next for Ethereum in Q4?
Q4 begins with October, a month often seen as bullish for the crypto market and commonly referred to as ‘Uptober.’ Historically, Q4 has been Ethereum’s strongest quarter, with a median return of around 22% and an average return of around 24%. However, Ethereum in 2025 is a very different asset compared to previous years. So, its performance may not fully follow past seasonal patterns.
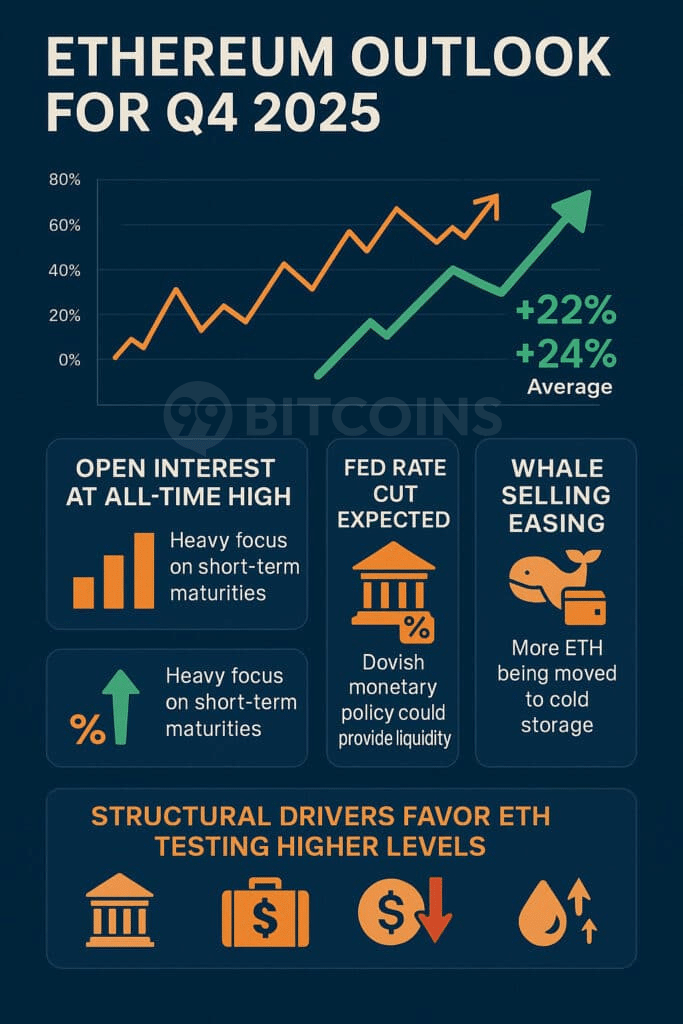
Open interest (OI) on the CME has climbed to record highs, mainly concentrated in short-term contracts (one to three months). This points to active institutional trading, though it may also bring short-term volatility around contract expirations. Meanwhile, longer-term contracts (three to six months) are steadily increasing, showing growing institutional confidence in Ethereum’s outlook.
- In the futures market, traders are pricing in a likely Fed rate cut, which could boost market liquidity and provide additional support for ETH.
- At the same time, whale selling has slowed, and many large holders are moving their ETH to cold storage, signaling long-term confidence ahead of potential market moves.
- While profit-taking may cause brief pullbacks, the overall setup for Q4 looks strong. A mix of supportive macro conditions, including political uncertainty, rising institutional participation, a weaker dollar, and ample liquidity, all suggest that Ethereum could push toward the higher ($6k-$8k) level in the coming quarter.
Breakdown of Major Crypto Sectors
Among all crypto sectors, RWAs, PerpDEX, Robotix, and DePIN gained the most traction in Q3, fueling speculation that the market may be on the verge of entering altcoin season. In fact, multiple indicators suggest we are likely entering the altcoin season. Consider this – The Altcoin Season Index is above 55, highlighting altcoins’ better performance relative to Bitcoin.
We also found the king coin’s dominance gradually declining towards the end of Q3, showing capital rotation. Rising stablecoin inflows indicate fresh liquidity entering the market. However, retail interest in altcoins is still in a lull. Google Trends data shows that people aren’t looking for altcoins as they did back in the 2021 bull run. Further, the SEC faces 16 spot ETF decisions in October; if most of these decisions are positive, the altcoin market will get a huge boost of liquidity. So, overall, the data gives a mixed signal. We haven’t entered the alt season yet, but we can’t rule out its possibility in Q4.
DeFi Market
- The DeFi market was led by Ethereum which held $99 billion in Total Value Locked (TVL) across 1,623 protocols. Solana ranked second with $13 billion in TVL and 375 protocols. However, the standout performer was the BSC Chain, with $9 billion in TVL. Over the past month, BSC’s TVL surged by 26%, significantly outpacing Ethereum’s 9% growth. BSC Chain also recorded the highest DEX volume, reaching $4.14 billion.
- Out of the top 10 DeFi coins, we found XRP’s price action quite intriguing. It crossed the $3 mark, signaling an upside potential of around 40%, with target prices projected between $3.98 and $4.32. The U.S. SEC is expected to approve the first XRP spot ETF by 18 October, a move that could attract up to $5 billion in new capital inflows and further boost XRP’s market activity.
- Hyperliquid processed nearly $330 billion in trading volume in July 2025, temporarily surpassing Robinhood. Over the past month, its trading volume surged by around 90%, reflecting strong market activity. While monthly active users dipped in July, the number rebounded in August and September. However, development activity showed a slight slowdown during July before picking up again later.
RWA Protocols
- The TVL locked in RWA protocols jumped sharply from $3.4 billion on 1 July to $16 billion by 30 September. Government securities made up the largest share of the RWA market capitalization by product category (daily).
- Meanwhile, the total value of on-chain RWAs reached $33.2 billion, marking a 13% increase over the past month. The number of asset holders rose to 417,583 (+8.9%), while asset issuers totaled 224. The total stablecoin value climbed to $293.1 billion (+5.5%), with 194.7 million holders, up 1.9% from 30 days ago.
- Ethena, Sky, and Maple remained the top three protocols by TVL. Among them, Ethena’s volume jumped by 24% in the past month, while Sky Protocol led the way with the highest volume of $1.4 billion.
Meme Coins
- Among the top 10 meme coins, Dogecoin stood out with strong performance in Q3 2025, nearly doubling in price by September. On the daily chart, $0.31487 served as a key near-term resistance level. After a quiet Q2, development activity showed renewed momentum in September, though social dominance remained lower than the highs seen in April 2025.
- In the past 30 days, the STOSHI meme coin recorded the highest gains, soaring by 5,390%. Over the past year, however, GOHOME stood out with an extraordinary 9.29M% increase. These projects appear to show signs of short-term hype or pump-and-dump behavior, rather than being sustainable, long-term projects.
- The launch of meme coins hasn’t slowed down. Every day, thousands of new tokens appear, many using copied code or created by unknown developers. This has raised serious cybersecurity concerns. Hackers are taking advantage of the political coin trend by sharing fake airdrop links and dangerous browser extensions that pretend to be wallet boosters or token claim tools.
DePIN Sector
- Even though the number of DePIN projects and devices grew quickly in June, the overall market cap stayed much lower than it was in January. In Q3, Akash Network led the decentralized computing space, Filecoin remained on top in decentralized storage, and Ankr Protocol dominated the infrastructure sector.
- DePIN saw a 400% industry surge in 2024, as per Messari. As of September 2025, the sector’s total market cap exceeded $37 billion. The World Economic Forum (WEF) predicts DePIN could grow into the trillions by 2028, transforming computing through a more distributed infrastructure.
NFT Market
- In Q3 2025, NFT sales reached $1.66 billion, up 20% from the previous quarter. Ethereum-based NFTs led the market with $97 million in sales, followed by Bitcoin-based NFTs at $60 million.
- The NFT space is shifting from the speculative hype in 2021 to a more utility-focused market. NFT gaming now makes up 38% of all transactions.
- High-end collection attracted demand, a CryptoPunk recently sold for $218,540, reflecting growing interest in blue-chip NFTs. Meanwhile, institutional investors now account for 15% of total NFT revenue, supported by clearer SEC and MiCA regulations.
Q4 Watchlist: Key Moves & Trends to Keep on Your Radar
- Earnings Season: Institutional sentiment from Q4 earnings could spill over into crypto markets.
- Retail Re-entry: Retail investors are slowly coming back to gold and crypto as rates ease.
- Fed Policy Path: All eyes on the Federal Reserve’s next move, more cuts or a pause?
- Key Data: CPI, unemployment, and wage growth will drive the rate and inflation expectations.
- Rising Bond Yields: G7 yields are climbing at a historic pace; tighter liquidity ahead.
- U.S. Tariffs: Higher tariffs and trade tensions could fuel inflation again.
- Geopolitics: Ongoing global tensions may trigger risk-off sentiment.
- Stablecoins: Rapid stablecoin supply growth signals more liquidity in crypto markets.
- BTC Whales: Watch on-chain whale movements for signs of accumulation or sell-offs.
- EIP-4844 Adoption: Ethereum’s proto-danksharding upgrade could boost L2 activity.
- GENIUS Act: U.S. implementation may bring clearer rules for stablecoins and payments.
- SEC Rulemaking: New digital asset regulations could shape institutional participation.
- Labor Market: Weak job data may push the Fed toward more easing, but hint at slowdown risks.
Support Our Research
We would appreciate it if you could credit our Q3 2025 Crypto Market Report with a link when using any data or insights from this analysis.
Disclaimer: This report is for informational purposes only and does not constitute financial, investment, or trading advice. Always do your own research before making financial decisions.
A Special Thanks to Our Partner: WEEX
![]()
WEEX crypto exchange stands out for its simplicity, trust and innovation. The platform makes trading easy with clear fees, smooth onboarding, and powerful tools for all users. It offers copy trading, perpetual futures, and a $30,000 welcome bonus (conditions apply) to enhance the trading experience. As a centralized exchange, WEEX supports spot, futures (up to 400x leverage), OTC, and copy trading across 1,000+ cryptocurrencies.
To ensure transparency and safety, WEEX maintains a 1,000 BTC USDT user protection fund with public Proof of Reserve and uses advanced security systems. Depending on the user level, KYC verification might be required for added account protection. 99Bitcoins found WEEX to be a reliable and easy-to-use exchange with strong liquidity and smooth performance. We highly recommend giving it a try.
The post 99Bitcoins’ Q3 2025 State of Crypto Market Report appeared first on 99Bitcoins.